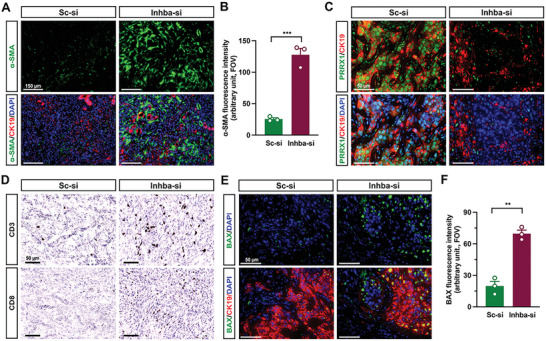
Figure 6.

Inhba siRNA increases the accumulation of α‐SMAhigh fibroblasts and infiltration of cytotoxic T cells. A) Representative IF staining with α‐SMA and CK19 of tumor sections(n = 3/group). Scale bar = 150 µm. B) Mean fluorescence intensity of α‐SMA. Field of view(FOV; n = 3/group). C) Representative IF staining with PRRX1 and CK19 of tumor sections(n = 3/group). Scale bar = 50 µm (B). D) Representative DAB staining of CD3 and CD8 with tumor sections(n = 3/group). scale bar = 50 µm. E) Representative IF staining of BAX and CK19(n = 3/group). Scale bar = 50 µm. F) Fluorescence intensity of BAX. **P<0.01; ***P<0.001.
