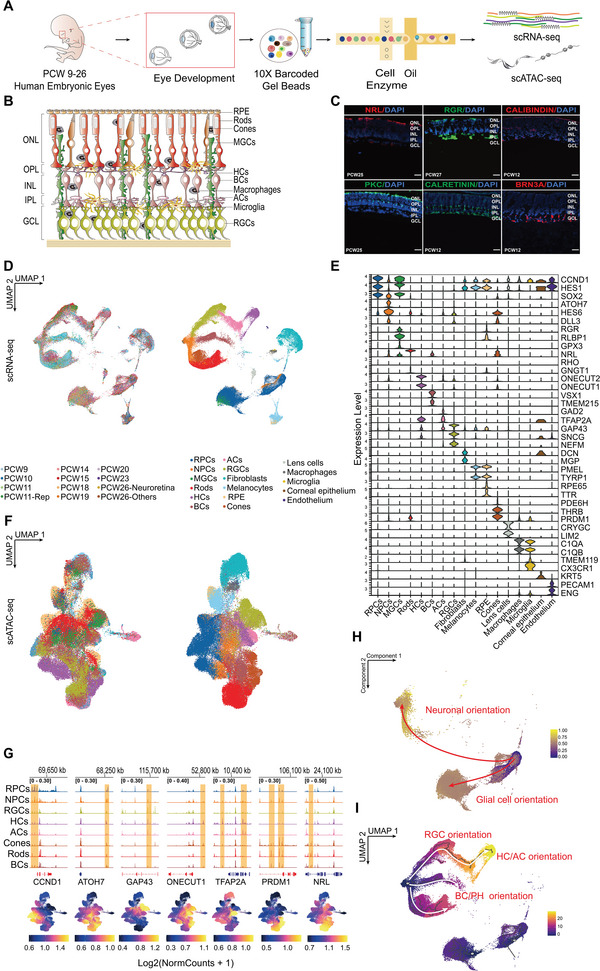
Figure 1.

A single‐cell regulatory atlas of the developing human retina. A) Schematic of experimental design. B) Retinal structure schematic. C) Immunofluorescence analysis of primary human retinal tissue validating the expression of cell‐type‐specific markers, including NRL (rods); RGR (MGCs); CALIBINDIN (HCs); PKC (BCs); CALRETININ (HCs, ACs, and RGCs); and BRN3A (RGCs). Nuclei are counterstained with DAPI. Scale bar, 50 µm. D) UMAP embedding of the retina scRNA‐seq dataset, with individual cells colored by age and annotated cell types. E) Violin plot showing relative expression of transcripts with high specificity for individual cell types ordered by cell type. F) UMAP embedding of the retina scATAC‐seq dataset, with individual cells colored by age and annotated cell types. G) Coverage plots and gene score of known marker genes for cell types. Gene color representing the direction of gene translation (red: right; blue: left). H) UMAP embedding of the developmental trajectories of RPCs, MGCs, and NPCs colored by pseudo‐time. Red arrows show two developmental directions from RPCs. I) UMAP embedding of the developmental trajectories of RPCs and RPC‐derived cells from scRNA‐seq colored by pseudo‐time. White arrows show three neuronal lineages. Abbreviations: PCW, post‐conception weeks; RGCs, retinal ganglion cells; HCs, horizontal cells; ACs, amacrine cells; BCs, bipolar cells; MGCs, Müller glial cells; GCL, ganglion cell layer; ONL, outer nuclear layer; OPL, outer plexiform layer; INL, inner nuclear layer; IPL, inner plexiform layer.
