Figure 3.

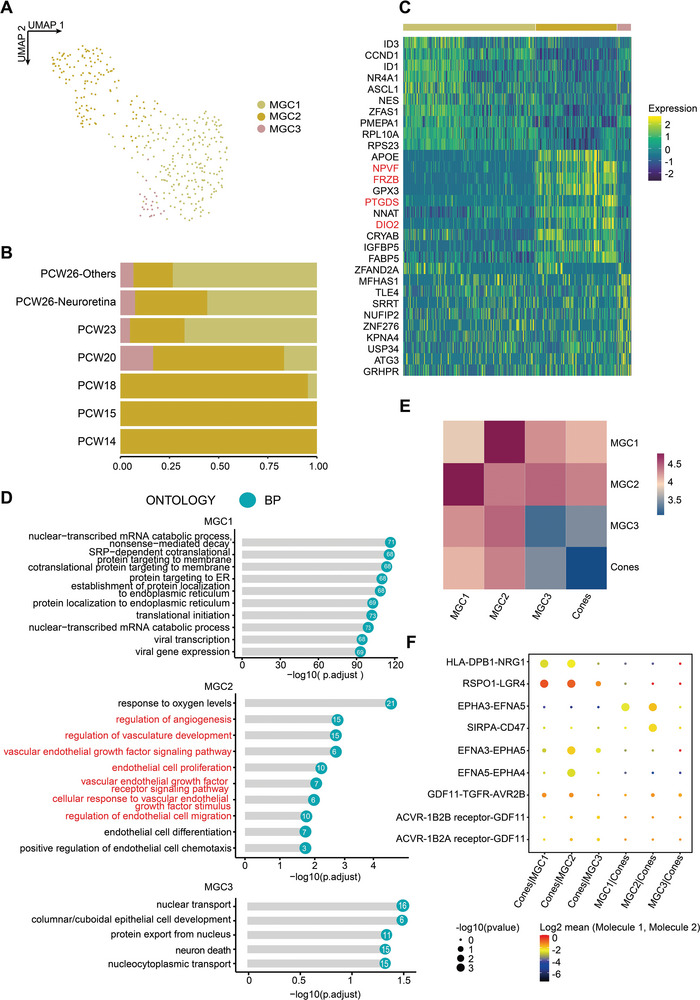
Characterization of MGC subpopulations. A) UMAP embedding of MGC subpopulations. B) Proportion of cell ages for MGC subpopulations. C) Heatmap showing the top 10 DEGsof MGC subclusters. D) Bar plots showing the top Gene Ontology: Biological Progress (GO:BP)terms calculated by using DEGs in MGC subpopulations. E) Heatmap showing the interaction relationship between MGC subpopulations and cones. F) Dot plots showing the ligand‐receptor interaction between MGC subpoplations and cones.
