Figure 5.

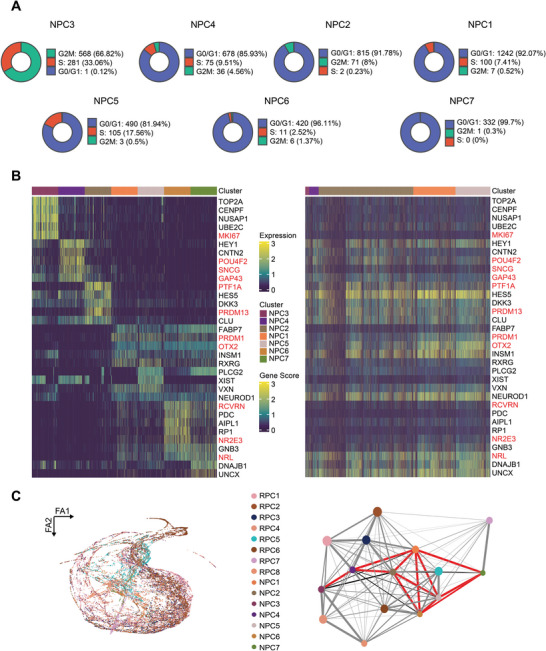
Resolution of the intrinsic relationship among NPCs and their developmental trajectories. A) Proportion of cells in the G1, S, and G2M phase in NPC subclusters. B) Heatmaps showing gene expression and gene score in NPC subclusters. C) Force‐directed graph (FDG) visualization of the differentiation trajectory of RPCs and NPCs. Partition‐based graph abstraction (PAGA) trajectory model imposed on the FDG visualization of the differentiation trajectory. The size of the dots is proportional to the number of cells in the clusters.
