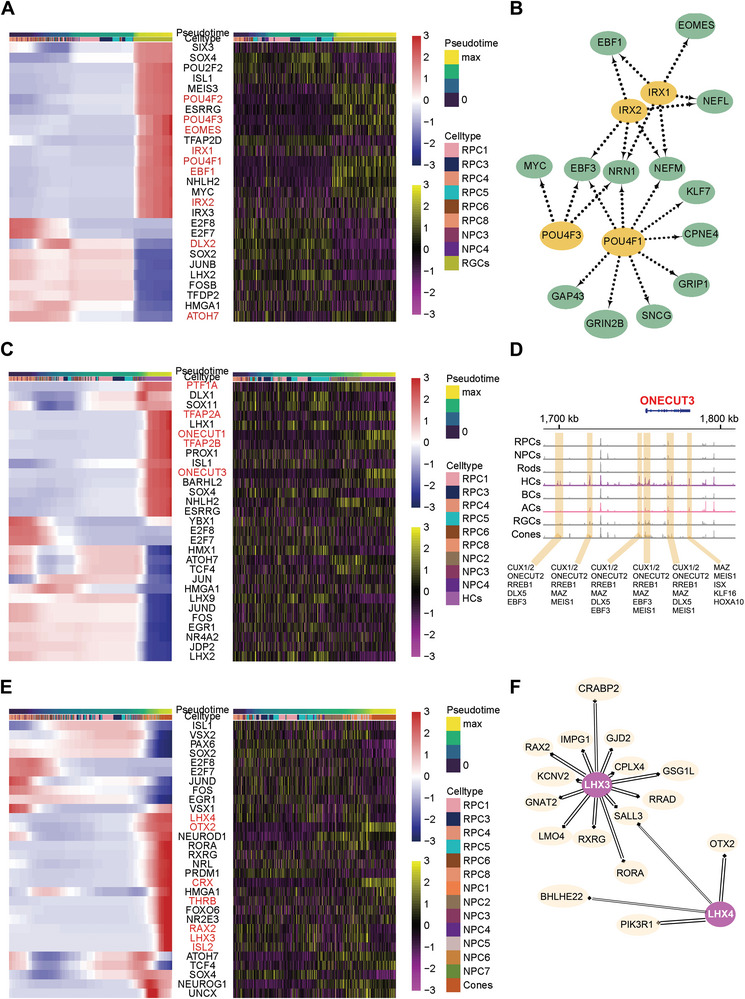
Figure 6.

Transcriptomic and epigenetic atlas of human developing retinal neuronal lineages. A) Heatmap of the expression and chromVAR activity scores of the top variable motifs for TFs found in the RGCs over pseudo‐time (bar at the top) and cell type (bar at the top). B) The regulatory networks of key TFs in the RGC lineage predicted by SCENIC analysis. C) Heatmap of the expression and chromVAR activity scores of the top variable motifs for TFs found in the HCs over pseudo‐time (bar at the top) and cell type (bar at the top). D) Coverage plot of accessibility near ONECUT3 split by cell type. Gene color represents the direction of gene translation (red: right). E) Heatmap of the expression and chromVAR activity scores of the top variable motifs for TFs found in the cones over pseudo‐time (bar at the top) and cell type (bar at the top). F) The regulatory networks of LHX3 and LHX4 in the BC/PH lineage predicted by SCENIC analysis.
