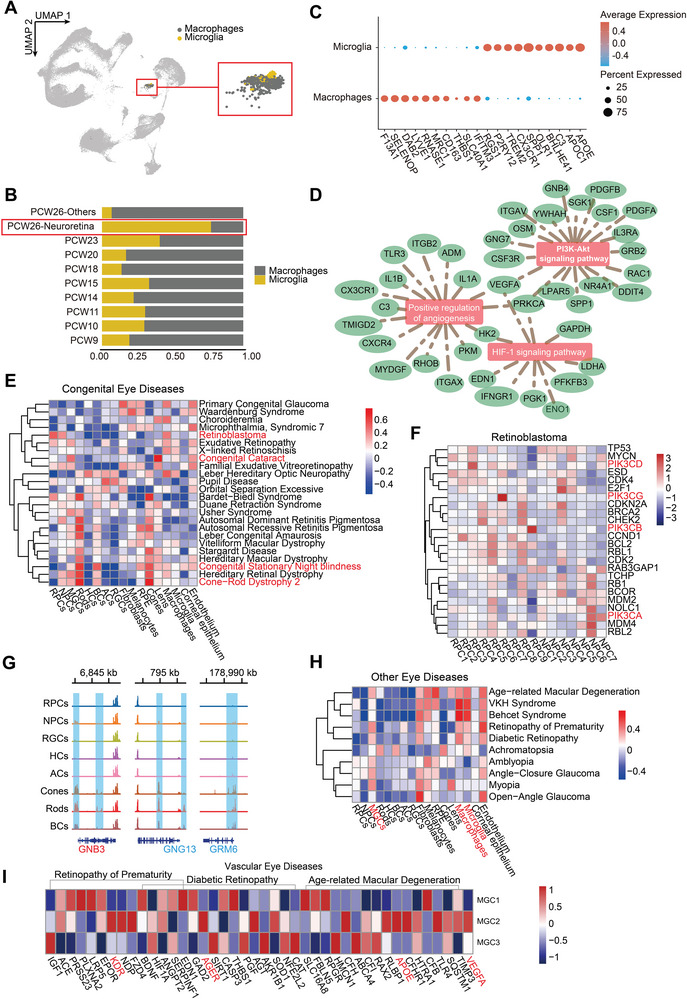
Figure 7.

Maps reveal human fetal retinal immune cells and ocular disease‐associated genes. A) UMAP embedding showing the location of macrophages and microglia. Red box present enlarged image. B) Relative proportions of macrophages and microglia at each age. Red box highlights quantity differences. C) Dot plot showing the top 10 DEGs between microglia and macrophages in embryonic human eyes. D) Networks showing the GO: BP terms related to angiogenesis calculated using the DEGs in microglia. E) Heatmap showing the relative expression of congenital eye disease‐related genes in different cell types. F) Heatmap showing the relative expression of retinoblastoma pathogenic genes in RPC and NPC subtypes. G) Coverage plot showing the chromVAR accessibility of GluR6. Gene color represents the direction of gene translation (red, right; blue, left). H) Heatmap showing the relative expression of concerned eye disease‐related genes in different cell types. I) Heatmap showing the relative expression of vascular eye disease‐related genes in MGC subclusters.
