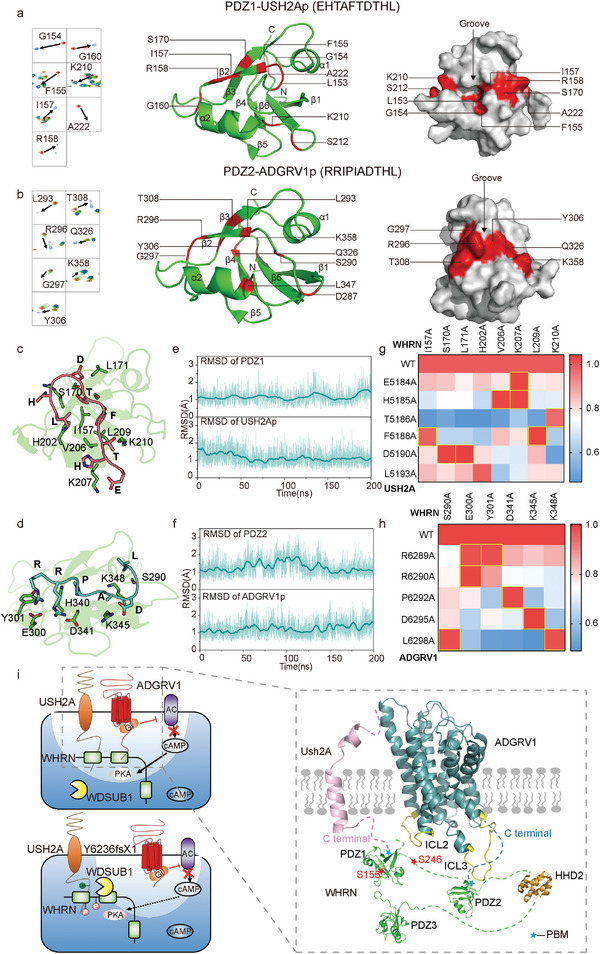
Figure 7.

Identification of potential hot spot interactions within ALC ternary complex by NMR, molecular dynamic simulation, and FlAsH‐BRET analysis. a) The cartoon and surface representation of the WHRN‐PDZ1 domain. The structure is derived from the NMR structure of human WHRN‐PDZ1 (PDB ID code: 1UEZ) which has 100% sequence identity with mice WHRN‐PDZ1. The residues with significant chemical shift change (Δδ > 0.3 ppm) or resonance intensity reduction (intensity ratio < 20%) upon the addition of USH2Ap are colored in red. b) The cartoon and surface representation of the WHRN‐PDZ2 domain. The structure is derived by Swiss‐model using the template of the NMR structure of human WHRN‐PDZ2 (PDB ID code: 1UF1) which has 97% sequence identity with mice WHRN‐PDZ2. The residues with significant chemical shift change (Δδ > 0.2 ppm) or resonance intensity reduction (intensity ratio < 20%) upon the addition of ADGRV1p are colored in red. c) The detailed interactions of C‐terminal residues of USH2A (salmon) with WHRN‐PDZ1 (green). d) The detailed interactions of C‐terminal residues of ADGRV1 (cyan) with WHRN‐PDZ2 (green). e) RMSD analysis of WHRN‐PDZ1/USH2Ap during 200‐ns molecular dynamics simulation trajectories by Gromacs. RMSDs of WHRN‐PDZ1 (upper panel) or peptide residues (lower panel) are shown. The initial modeled complex state after equilibration (0 ns) was used for calculation. f) RMSD analysis of WHRN‐PDZ2/ADGRV1p during 200‐ns molecular dynamics simulation trajectories by Gromacs. RMSDs of WHRN‐PDZ2 (upper panel) or peptide residues (lower panel) are shown. The initial modeled complex state after equilibration (0 ns) was used for calculation. g) Pairing of WHRN mutants with USH2A (WT and mutants) through alanine scanning and FlAsH‐BRET assay. The saturation BRET value between a given WHRN mutant and the WT USH2A was used as the reference (normalized to 1) and the saturation BRET value between the same WHRN mutant and the other USH2A mutant was normalized to the above value. The USH2A mutants that did not show significantly decreased BRET signal compared to the WT USH2A when interacting with a given WHRN mutant are deduced to be potential hot spot interaction pairs and are circled in yellow (for example, USH2A‐F5188 and WHRN‐I157). Data are correlated to Figure S8c, Supporting Information and are from three independent experiments (n = 3). h) Pairing of WHRN mutants with ADGRV1 (WT and mutants) through alanine scanning and FlAsH‐BRET assay. Data are processed as described in Figure 7g. Data are correlated to Figure S8d, Supporting Information and are from three independent experiments (n = 3). i) Schematics illustrating the interaction mode of ADGRV1‐WHRN‐USH2A ternary complex. The C‐terminal PBM of USH2A and ADGRV1‐ICL2 prefer to interact with WHRN‐PDZ1 while the ADGRV1 C‐terminus and ICL3 favor engaging with WHRN‐PDZ2 (right). Endogenously phosphorylated WHRN recruits WDSUB1 and promotes the ubiquitination and degradation of USH2A. ADGRV1 inhibits WHRN phosphorylation through compartmental cAMP‐PKA signaling and increases USH2A stability (left upper). In contrast, the Y6236fsX1 showed inferior effects on USH2A ubiquitination compared with the wide‐type ADGRV1, due to its inability to form a functional ALC and to locally dephosphorylate WHRN (left bottom).
