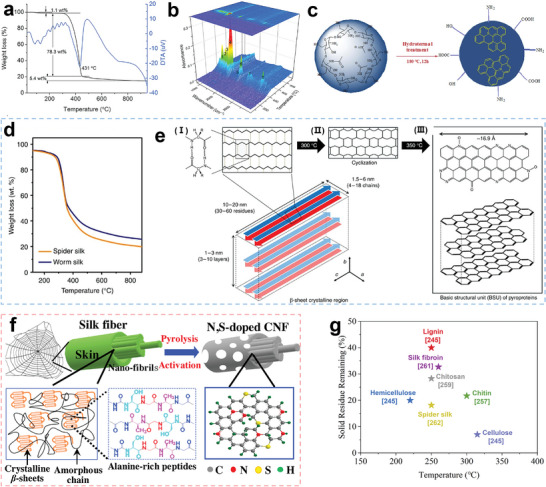
Figure 9.

a) TGA and DTA curves of chitin. Reproduced with permission.[ 257 ] Copyright 2015, WILEY‐VCH. b) 3D on‐line FTIR spectra of chitin during carbonization, and the labelled peaks are 1) C—O stretching, 2) O—H bending, 3) N—H bending, 4) C = O stretching, 5) CO, 6) CO2, 7) C—H stretching, and 8) O—H stretching. Reproduced with permission.[ 257 ] Copyright 2015, WILEY‐VCH. c) Increase in the surface functional groups of chitosan after HTC treatment. Reproduced with permission.[ 260 ] Copyright 2015, WILEY‐VCH. d) TGA curves of worm silk and spider silk. Reproduced with permission.[ 262 ] Copyright 2015, The authors, Springer Nature. e) Schematic of the formation of BSUs. Reproduced with permission.[ 262 ] Copyright 2015, The authors, Springer Nature. f) Schematic of the preparation of spider silk‐derived carbon fiber. Reproduced with permission.[ 263 ] Copyright 2016, Elsevier. g) Decomposition temperature and solid residue remaining in several plant and animal biomasses.
