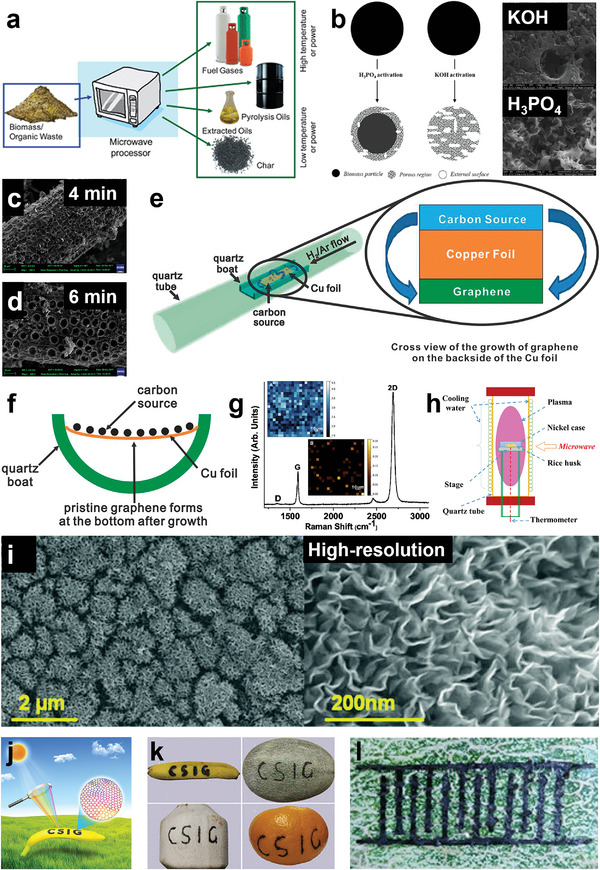
Figure 13.

a) Illustration of MAP concept. Reproduced with permission.[ 302 ] Copyright 2012, RSC. b) Pore development schematic diagrams and SEM photographs of H3PO4 or KOH activated CPH carbon. Reproduced with permission.[ 305 ] Copyright 2019, ACS. SEM of oil palm male flowers derived nanoporous carbons by microwave‐assisted activation: c) 4 min and d) 6 min of irradiation time. Reproduced with permission.[ 306 ] Copyright 2020, The authors, MDPI. e) Schematic diagram of the experimental apparatus for the growth of graphene from biomass. Reproduced with permission.[ 308 ] Copyright 2011, ACS. f) Diagram of the graphene growth in the apparatus. Reproduced with permission.[ 308 ] Copyright 2011, ACS. g) Raman spectrum and Raman spectral mapping (scanning was performed at every 5 µm over an area of 100 µm × 100 µm.) of 2D/G, D/G ratio in dog feces derived graphene. Reproduced with permission.[ 308 ] Copyright 2011, ACS. h) Diagram of the setup for MPI method. Reproduced with permission.[ 309 ] Copyright 2015, Elsevier. i) SEM and high‐resolution SEM images of honeycomb derived graphene. Reproduced with permission.[ 310 ] Copyright 2015, RSC. j) Schematic diagram of concentrated solar induced graphene preparation. Reproduced with permission.[ 312 ] Copyright 2022, The authors, RSC. k) Photograph of concentrated solar induced graphene patterned into a shape of the letters “CSIG” on banana peel, cantaloupe peel, coconut peel, and orange peel. Reproduced with permission.[ 312 ] Copyright 2022, The authors, RSC. l) Image of concentrated solar induced graphene patterned into 12 interdigital electrodes with a line width of ≈2 mm on cantaloupe peel. Reproduced with permission.[ 312 ] Copyright 2022, The authors, RSC.
