
Figure 19.
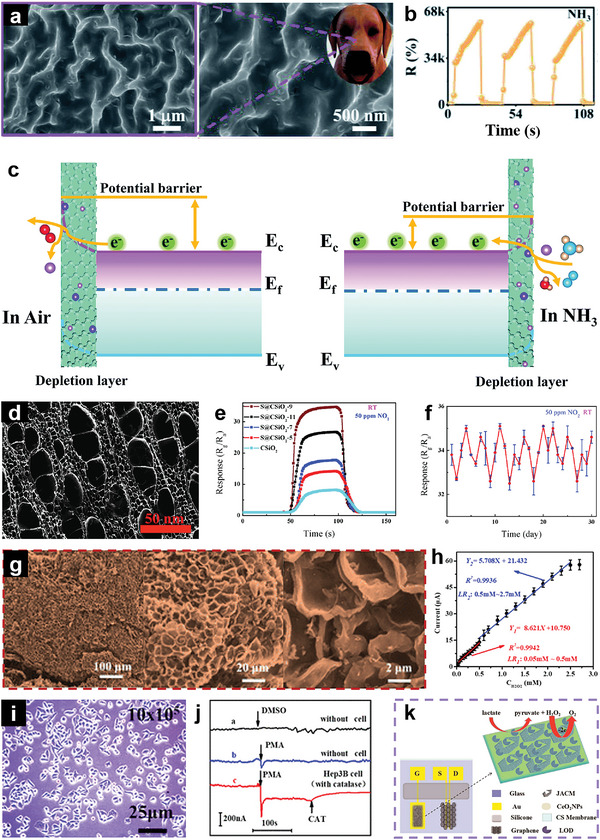
a) SEM images with different resolutions of CRT. Reproduced with permission.[ 392 ] Copyright 2022, RSC. b) Sensing curves of the CRT toward 500 ppm NH3. Reproduced with permission.[ 392 ] Copyright 2022, RSC. c) NH3 detection mechanism of the CRT sensor. Reproduced with permission.[ 392 ] Copyright 2022, RSC. d) Cross‐sectional SEM image of S@CSiO2. Reproduced with permission.[ 393 ] Copyright 2019, Elsevier. e) Gas response curves of the S@CSiO2 samples with various fabrication parameters for 50 ppm NO2 at RT. Reproduced with permission.[ 393 ] Copyright 2019, Elsevier. f) Long‐term gas response stability of the S@CSiO2‐9 device measured with 50 ppm NO2 for 30 days. Reproduced with permission.[ 393 ] Copyright 2019, Elsevier. g) SEM images of TS‐HTC. Reproduced with permission.[ 395 ] Copyright 2021, ACS. h) Response current of TS‐HTC as a function of H2O2 concentration. Reproduced with permission.[ 395 ] Copyright 2021, ACS. i) Microscopic photos of Hep 3B cells. Reproduced with permission.[ 395 ] Copyright 2021, ACS. j) Real‐time monitoring of H2O2 released by TS‐HTC with the addition of dimethyl sulfoxide (DMSO) without cultured Hep 3B cells (curve a), the addition of PMA (curve b), and PMA with catalase (curve c) with cultured Hep 3B cells in PBS at −0.3 V (vs Ag/AgCl). Reproduced with permission.[ 395 ] Copyright 2021, ACS. k) Schematic diagram of a solution‐gated graphene transistor. Reproduced with permission.[ 395 ] Copyright 2021, ACS.