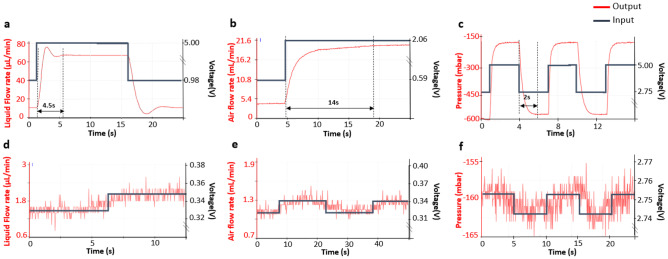
Fig. 6.
Responses of the flow controllers for liquid flow, airflow, and vacuum level. Figures a and d show a settling time of 4.5 s and a resolution of 0.6 L min respectively for the flow controller with liquid flow. Figures b and e show a settling time of 14 s and a resolution of 0.2 mL min respectively for the flow controller with airflow. Figures c and f show a settling time of 2 s a resolution of 3 mbar respectively for the flow controller used to generate the desired vacuum. The black lines represent the applied voltage levels (shown on the right side of the y-axes) to the controllers, while the red lines are the system responses (shown on the left side of the y-axes). The dashed lines represent that the settling times are defined as the result reaches within 2 % of the desired stable values. These values are suitable for a lung-on-a-chip experiment parameters described in Table 2. The noise seen in Fig 6d-f is due to 8-bit ADC. It can be improved by using higher bit ADC or averaging the data. According to the manufacturer, the accuracy of the mass flow controller is for water and for air, and of the pressure controller is for air

