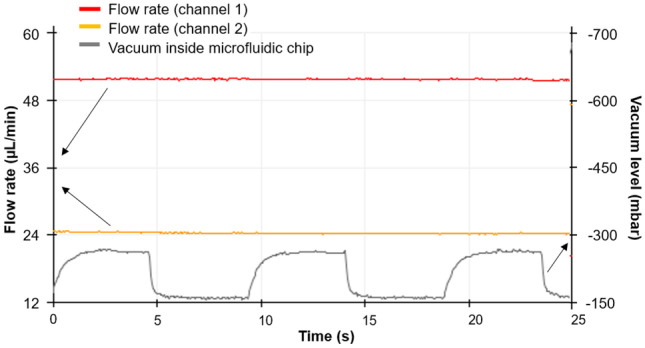
Fig. 8.

Flow rate/vacuum display. The y-axis on the left shows different flow rates for fluid flowing through flow path 1 and flow path 2. The y-axis on the right shows the (cyclic) vacuum level. The x-axis represents time. In this particular example, the liquid flow rate in flow path 1 was 51 Lmin while the liquid flow rate in path 2 was 24 Lmin. Vacuum level in the cyclic vacuum subsystem was from 157 mbar to 280 mbar with a period of 0.1 Hz, desired values in lung-on-a-chip applications. The arrows show the relevant y-axis for the data
