Fig. 4.
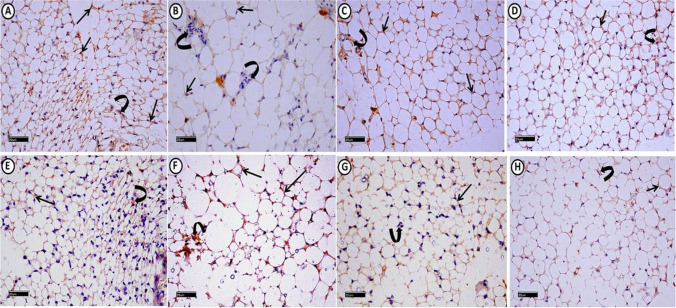
A photomicrograph of epididymal white adipose connective tissue sections from all experimental groups immuno-histochemicaly stained with: (I): IGF-1: Control group (A), shows extensive positive cytoplasmic immuno-reaction in most of adipocytes (arrows) and connective tissue (C.T.) cells in between adipocytes (curved arrow). MS group (B) shows mild immuno-reactivity in adipocytes (arrows) and negative immuno-reaction in C.T. cells (curved arrows). MS + Dulaglutide (C) and MS + Resveratrol (D) groups exhibit strong cytoplasmic immuno-reaction in both of adipocytes (arrows) and C.T. cells (curved arrows). (II): TNF-α: Control group (E), expresses minimal cytoplasmic immuno-reaction in adipocytes (arrow) and C.T. cells (curved arrow). In MS group (F), marked TNF-α immuno-reactivity is found in most of adipocytes (arrows) and C.T. cells (curved arrow). MS + Dulaglutide (G) and MS + Resveratrol (H) groups, show mild immuno-reaction in adipocytes (arrows) and C.T. cells (curved arrows) (IGF-1 immuno-stain (A, B, C, D) & TNF-α immuno-stain (E, F, G, H) Scale bar = 20 µm)

