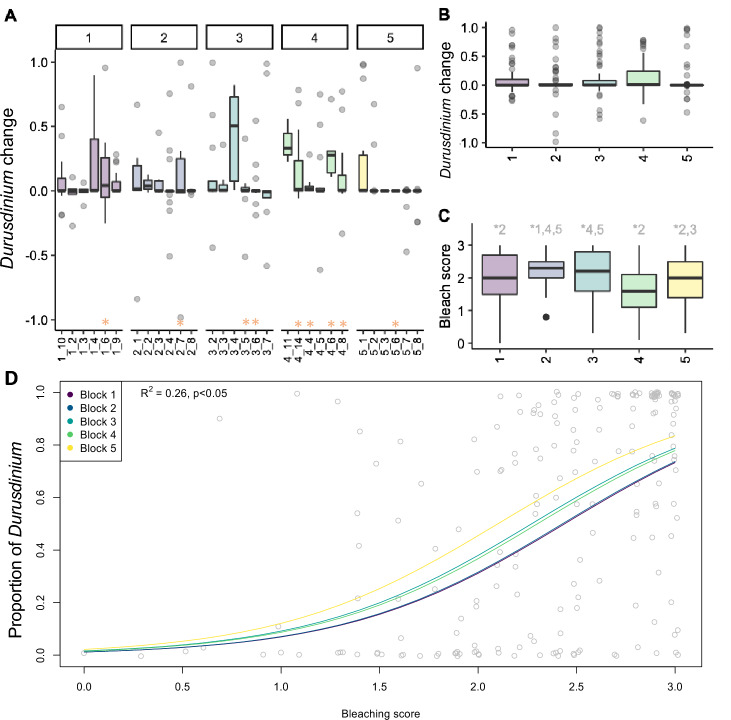
Figure 2.
Change in Durusdinium in M. capitata in Kāne’ohe Bay in 2018 and 2019. (A) Boxplot of difference of proportion of Durusdinium in 2019 and 2018 in each site, in each of the 5 blocks. Sites in which the maximum temperature in 2019 exceeded + 1 °C above the previous year’s maximum are highlighted (*) on the axis. (B) Boxplot of difference of proportion of Durusdinium in 2019 and 2018 in each of the 5 blocks. (C) Bleaching score per block (3: healthy, 0: fully bleached); numbers at the top of (C) represent significant comparisons from pairwise PERMANOVA. (D) General linear regression of the proportion of Durusdinium per bleaching score, colored per block; McFadden’s R-square and significance included in the top left.

