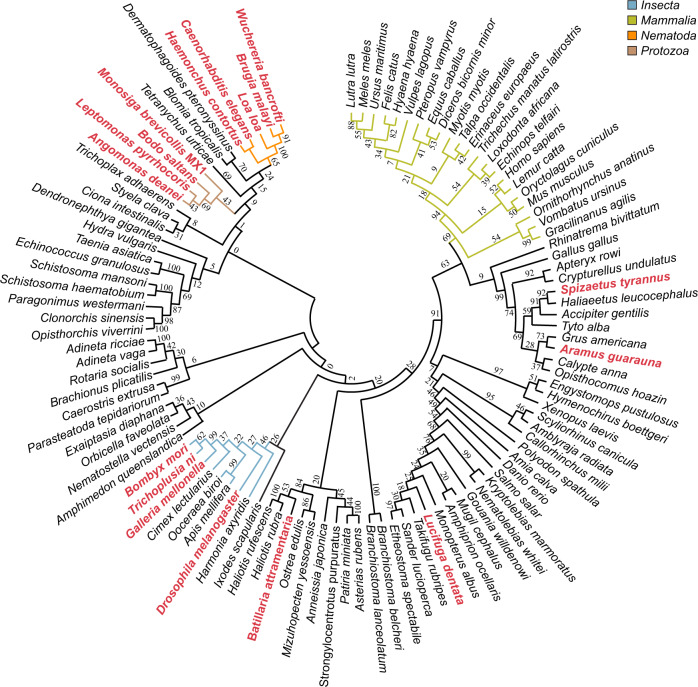
Fig. 1. Evolutionary analysis of HPF domain.
The phylogenetic tree was constructed with amino acid sequences isolated from their whole protein context by multiple sequence alignment. The evolutionary history was inferred using the maximum-likelihood method under the LG model of amino acid substitution as implemented in MEGA11. The bootstrap consensus tree is shown and was inferred from 1000 replicates to represent the evolutionary history of the taxa analysed. Species in which no ARH3 could be identified by BLAST search are highlighted in red. Relevant clades are highlighted by coloured branches (Insecta, blue; Mammalia, green; Nematoda, orange; Protozoa, brown). Sequence data are provided in Supplementary Data 1.

