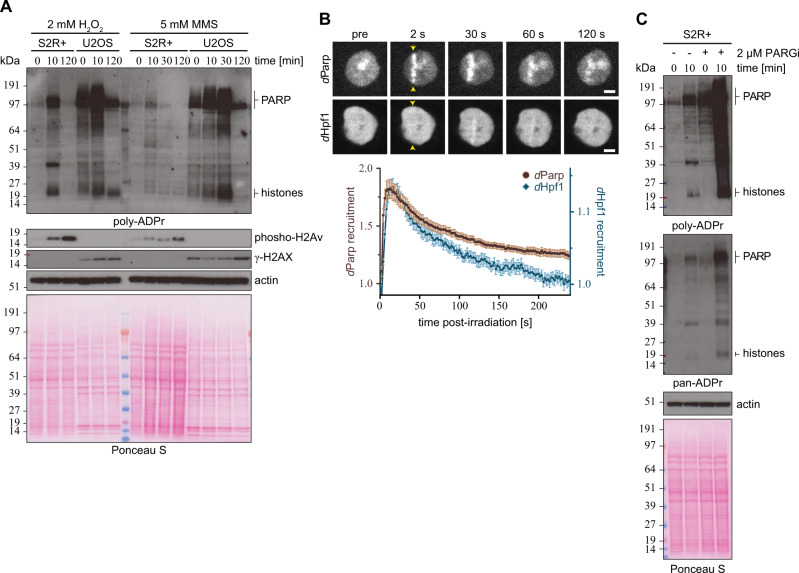
Fig. 2. ADP-ribosylation upon genotoxic stress in Drosophila S2R+ cells.
A Drosophila S2R+ and human U2OS cells were treated with either 2 mM H2O2 or 5 mM MMS and analysed at indicated time points. The cells were lysed, and proteins were separated by SDS-PAGE and then analysed for poly-ADPr levels by immunoblot. Actin and Ponceau S staining was used as a loading controls. The ‘PARP’ and ‘histones’ labels next to the image denote the approximate sizes where these proteins can be found. The experiment was repeated independently three times with similar results. B Representative images (top) and kinetics (bottom) of EGFP-dParp and EGFP-dHpf1 recruitment to sites of DNA damage induced by 405 nm laser irradiation, in Drosophila S2R+ cells. Scale bar, 2 µm. Data from B are a representative of 3 independent replicates (6–10 cells per replica per condition) with n = 24 cell for EGFP-dParp and n = 22 cell for EGFP-dHpf1 and represent normalised mean values ± SEM. Sites of irradiation are indicated by yellow arrows. C S2R+ cells were pre-treated with DMSO or 2 μM PARGi (PDD00017273) for 16 h followed by 2 mM H2O2 treatment for the indicated time in the absence or presence of PARGi. Poly-ADPr (left panel) and pan-ADPr (right panel) levels were analysed by immunoblot. The ‘PARP’ and ‘histones’ labels next to the image denote the approximate sizes where these proteins can be found. The experiment was repeated independently three times with similar results.

