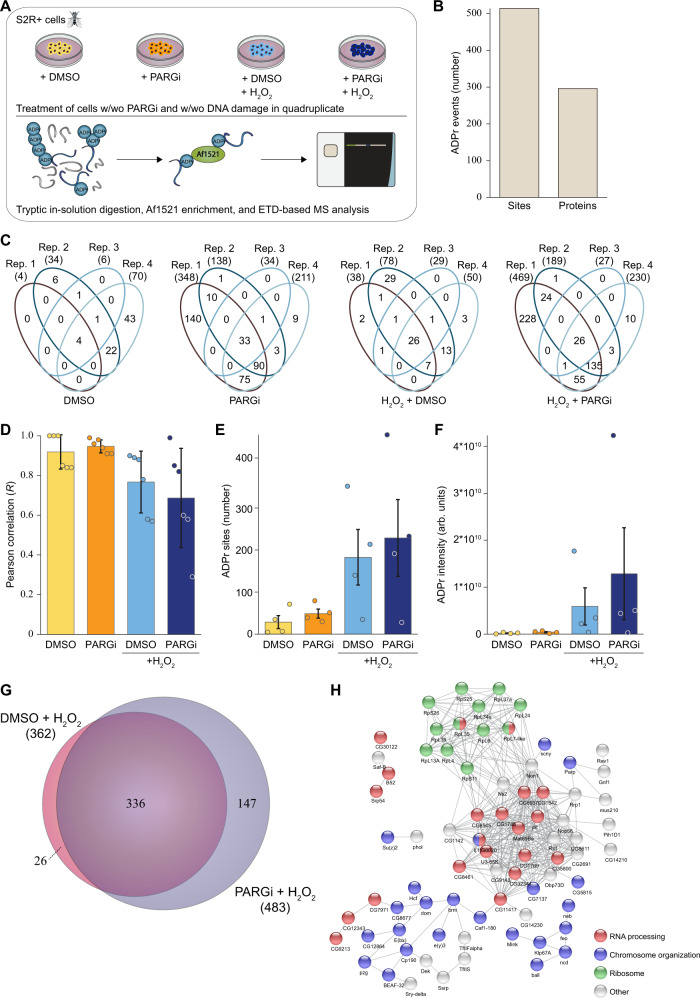
Fig. 3. Mass spectrometric identification of ADPr sites in S2R+ cells.
A Experimental overview. S2R+ cell cultures were treated with DMSO or 2 μM PARGi (PDD00017273) under control conditions or DNA damage conditions (H2O2) in quadruplicate. Lysates were in-solution digested, and ADPr-modified peptides were enriched using in-house produced GST-tagged Af1521. ADPr samples were analysed on a Thermo Orbitrap Fusion Lumos using EThcD-based fragmentation. The Figure was partly generated using Servier Medical Art, provided by Servier, licensed under a Creative Commons Attribution 3.0 unported license. B Histogram showing the total number of identified and localised ADPr-modified sites and proteins. C Venn diagrams depicting the distribution of unique ADP-ribosylated peptides identified across the four different approaches. D Average Pearson correlation of identified ADPr sites from the four conditions. Represented are mean values of n = 6 ±SD. E Overview of the number of identified and localised ADPr sites. n = 4 cell culture replicates, data are presented as mean values ± SEM. (F) As (D), showing ADPr intensity. Each cell culture condition was prepared in quadruplicates and data are presented as mean values ± SEM. G Scaled Venn diagram depicting the overlap between ADPr sites identified under DMSO and PARGi conditions, both upon H2O2 treatment. H STRING network visualising functional interactions between proteins with ADPr sites specifically found under PARGi-treated conditions. Minimum required interaction score was set to high confidence (0.7), and disconnected proteins were omitted from the network. Proteins were annotated with colours as highlighted in the figure legend.

