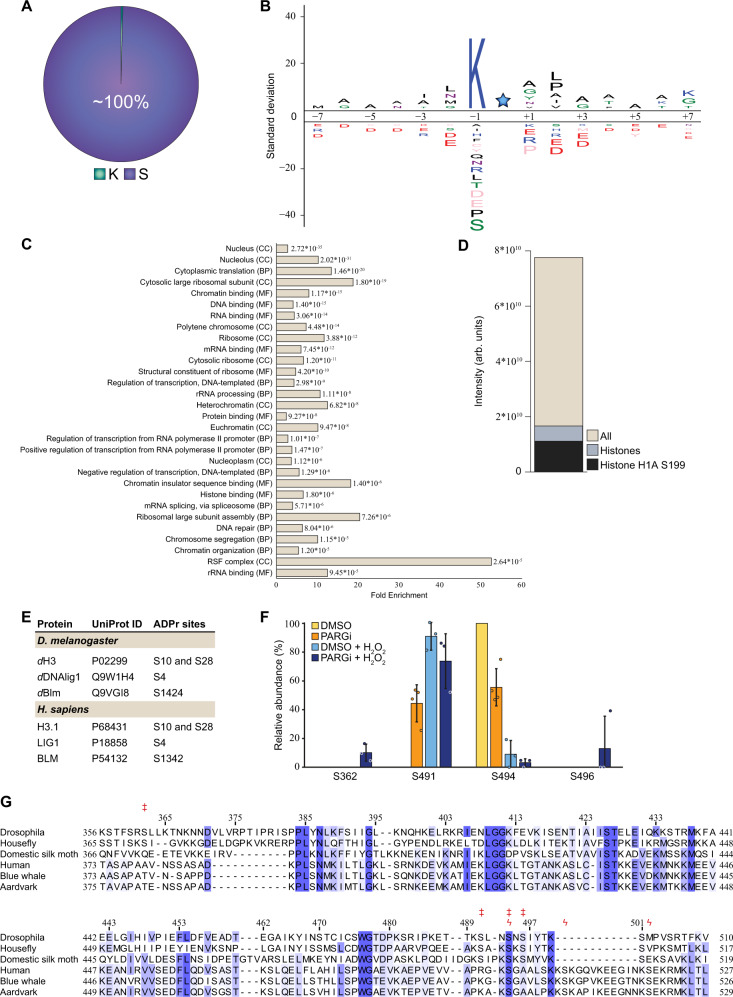
Fig. 4. Site-specific properties of the ADP-ribosylome.
A Pie chart visualising the distribution of ADPr-modified amino acid residues. B IceLogo analysis showing the sequence context surrounding identified serine ADPr sites (light blue star), with amino acid residues above the line being enriched. Sequence windows from all serine residues in ADPr target proteins were used as a reference. C Gene Ontology analysis visualising the enrichment of all Ser-ADPr target proteins compared to the total genome. CC Cellular compartment; BP Biological process; MF Molecular function. D Histogram showing the overall intensity of ADPr sites, the ADPr intensity from histones, and the ADPr intensity from histone H1A Ser199. E Table comparing ADPr sites identified in Drosophila to ADPr sites identified in human. F dParp automodification analysis, showing the relative modification abundance based on MS/MS intensity. n = 4 cell culture replicates, data are presented as mean values ± SD. G Multiple sequence alignment of selected insect and mammalian PARP automodification domain sequences. Ser-ADPr sites identified in dParp and hPARP1 are indicated above the alignment by double-dagger (‡) and koppa (ϟ) symbol, respectively. Indexing indicates dParp residue position. Extended insect alignment is provided in Supplementary Fig. 2 and sequences in Supplementary Table 1.

