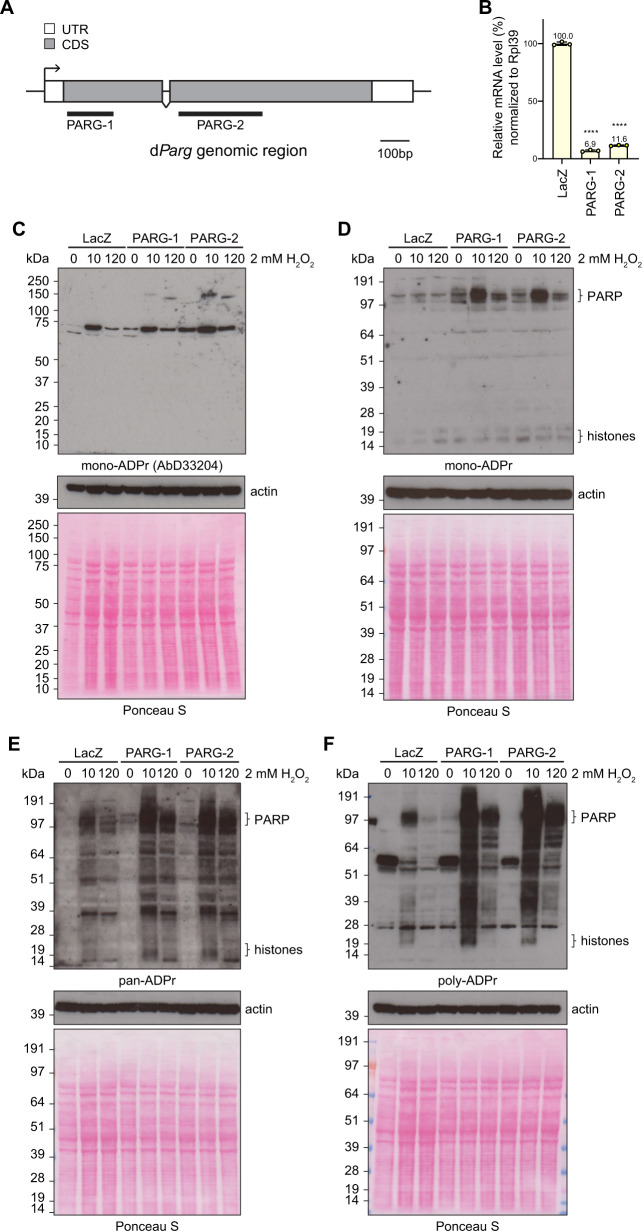
Fig. 5. dParg removes mono-Ser-ADPr in vivo.
A Schematic structure of the dParg gene genomic region. White boxes and grey boxes show the untranslated region and the coding region of the dParg gene, respectively. Black overlines show regions targeted by PARG dsRNAs. B The relative gene expression analysis of the dParg gene in S2R+ cells as determined by RT-qPCR and normalised using the RpL39 gene as an internal control. Error bars indicate average SD from three independent replicas. Asterisks indicate statistical significance compared with the control, as determined by t-test (****p < 0.0001, Two-tailed P-value, PARG-1 vs LacZ, p = 6.9 × 10⁻⁸, PARG-2 vs LacZ, p = 6.3 × 10⁻⁸). Drosophila S2R+ cells were treated with 2 mM H2O2 analysed at indicated time-points. C–F Proteins from whole-cell lysates were separated by SDS-PAGE and then analysed by immunoblot using mono-ADPr- (MAR antibody AbD33204. C mono-ADPr- (MAR detection reagent MABE1076. D pan-ADPr- (Both PAR and MAR detection reagent, MABE1016. (E) and poly-ADPr- (antibody 4336-BPC-100. F Binding reagent. Ponceau S staining and actin were used as a loading control. The ‘PARP’ and ‘histones’ labels next to the image denote the approximate sizes where these proteins can be found. These experiments were repeated independently three times with similar results.

