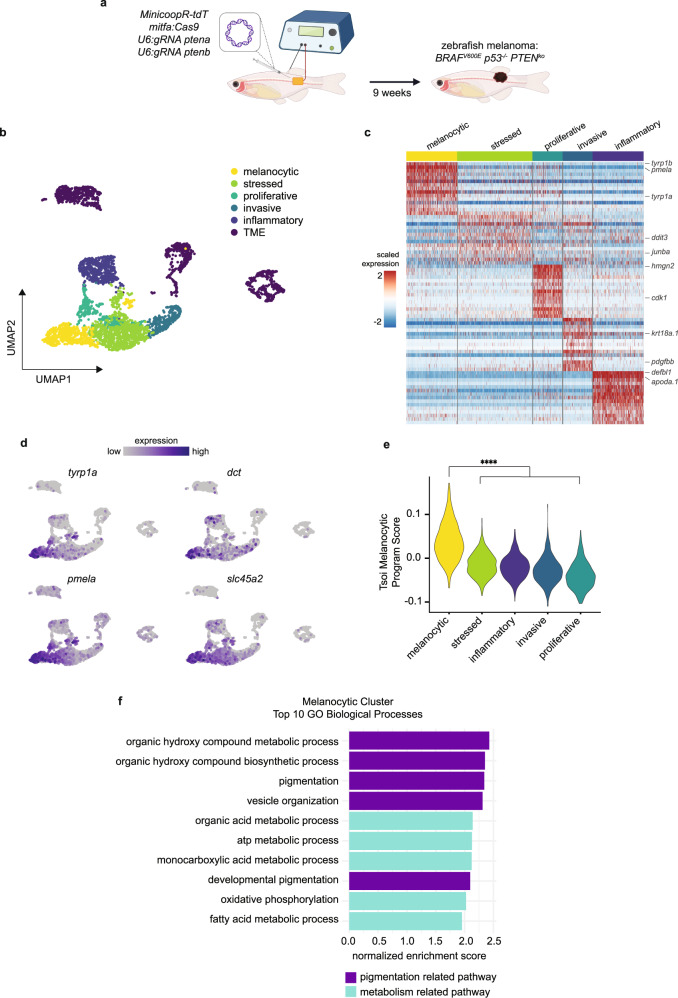
Fig. 1. Zebrafish melanoma displays distinct transcriptional states where melanocytic cell state upregulates oxidative metabolic pathways.
a Schematic of zebrafish TEAZ. Transgenic casper;mitfa:BRAFV600E;p53−/− zebrafish were injected with tumor-initiating plasmids and electroporated to generate BRAFV600E p53-/- PTENko melanomas. b UMAP dimensionality reduction plot of melanoma and TME cells. Cell assignments are labeled and colored. c Heatmap of top 15 differentially expressed genes in each melanoma transcriptional cell state. Select genes labeled. d UMAP feature plots showing scaled gene expression of pigmentation genes (tyrp1a, dct, pmela, slc45a2). e Tsoi Melanocytic Program4 module scores for cells in each melanoma cell state. Adjusted p values were calculated using Wilcoxon rank-sum test with Holm correction. **** p < 0.0001. f Top 10 enriched GO Biological Processes in melanocytic cluster filtered by multi-level Monte Carlo with Benjamini-Hochberg adjusted p values < 0.05. Pathways are color-coded based on pigmentation or metabolism-related pathways. Figure 1a was created with BioRender.com.

