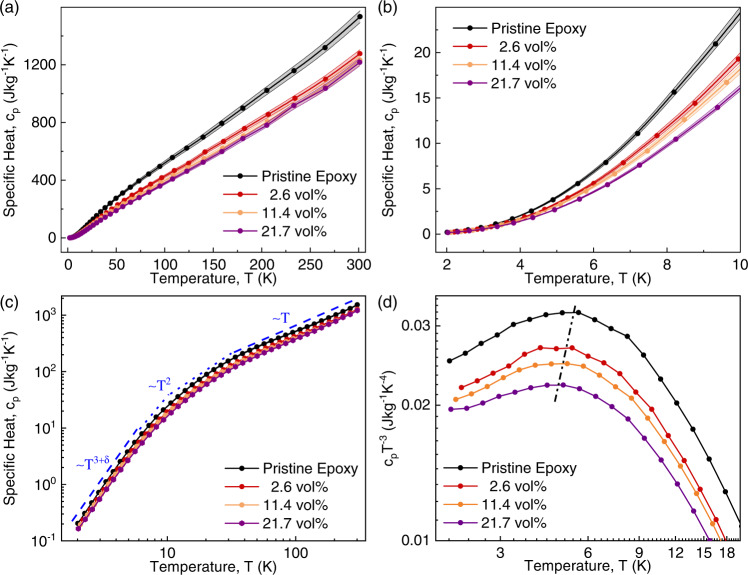
Fig. 2. Specific heat of graphene composites.
a Temperature-dependent specific heat of composites in the temperature range of . b The same data as in a is shown in the low-temperature limits. c Specific heat of the composites plotted in the log-log scale, revealing the quasi-cubic, parabolic, and linear temperature dependence in the low, intermediate, and high-temperature ranges. d The “Debye-reduced” specific heat of graphene composites as a function of temperature in a log–log scale. The dashed line is a guide to the eye, showing the behavior of the so-called “boson peak” as a function of filler loading and temperature.

