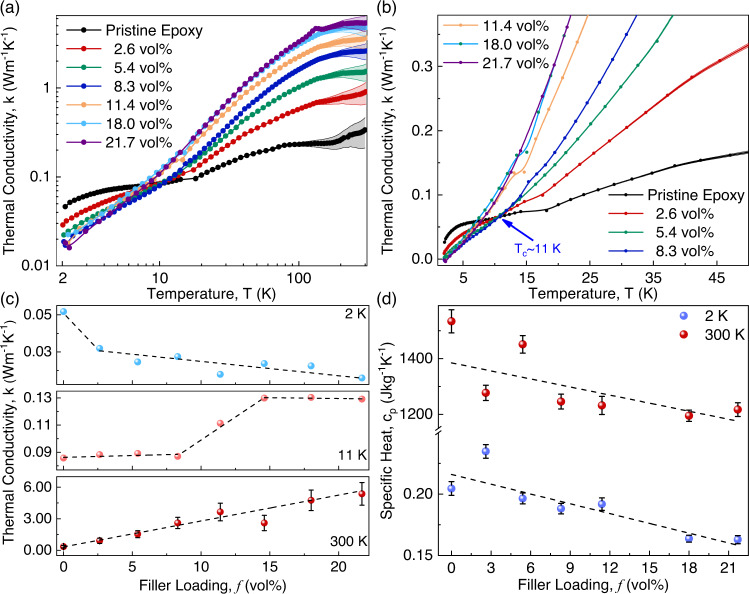
Fig. 3. Temperature-dependent thermal transport characteristics of graphene composites.
a Thermal conductivity of graphene composites in the temperature range of in the log-log scale. The symbols are the experimental data points. The shaded area indicates the experimental uncertainty. b Thermal conductivity of the graphene composites in the low-temperature region, showing the cross-over temperature, . c Thermal conductivity of the graphene composites as a function of the filler loading at , , and RT. The errors associated with the data for 2 K and 11 K are smaller than the size of the symbols and are not shown. d Specific heat of the graphene composites as a function of the filler loading at constant temperatures of and .

