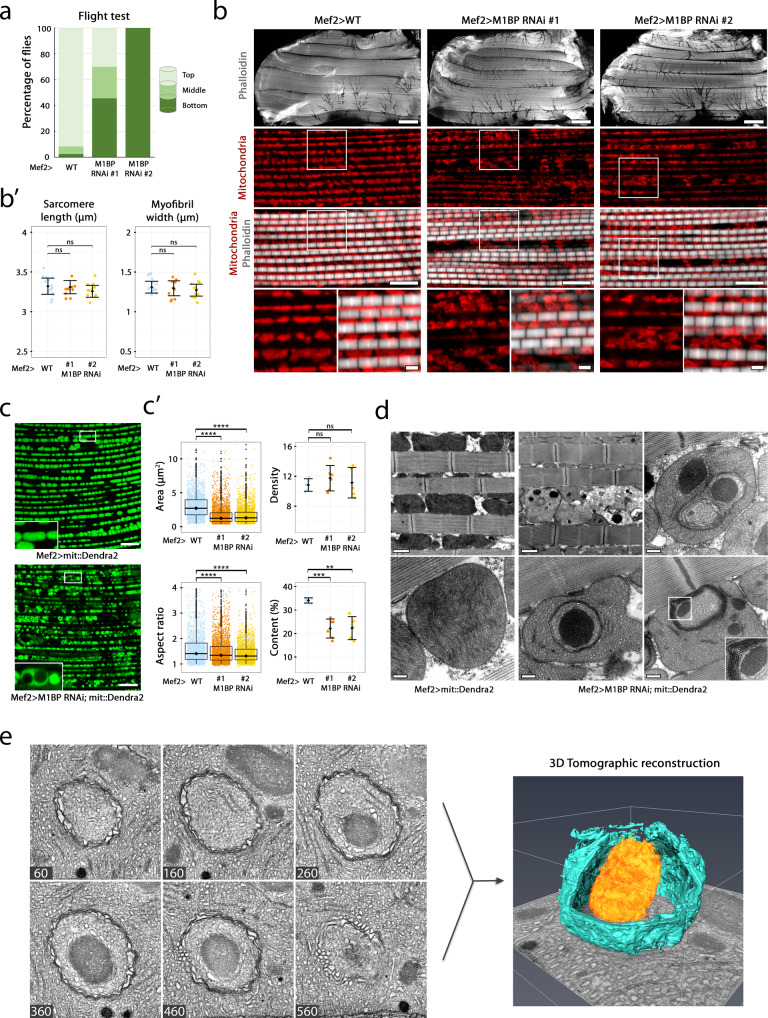
Fig. 1. M1BP downregulation in flight muscles leads to mitochondrial ultrastructural defaults.
a Flight ability was scored as a mean percentage of male flies landing on column segments, from two independent biological replicates (nWT = 150, n#1 = 90 and n#2 = 20). b Confocal sections of female wild-type (left) and M1BP-depleted DLMs with two different RNAi lines, (#1 and #2) driven by Mef2-GAL4. White rectangle represents an enlarged view. Myofibrils are stained with phalloidin (grey) and mitochondria with anti-ATP5A antibody (red). The scale bar is 100 µm (top), 10 µm (middle) and 2 µm (bottom views). b’ Quantification of muscle parameters, each dot corresponding to one animal (nWT = 15, n#1 = 10 and n#2 = 11 flies). Mean and standard errors are indicated. After applying Shapiro–Wilk test for normality, two-sided Mann–Whitney test was applied (p-values (length) = 0.87 and 0.1 and p-values (width) = 0.53 and 0.44). c Confocal sections of live 2-days-old female adult wild-type (left) and M1BP-depleted (right) DLM mitochondria labelled with mit::Dendra2, driven by Mef2-GAL4. Scale bars represent 10 µm. c’ For area and aspect ratio quantification, data are represented in boxplots (median and quartiles) with whiskers (minimum to maximum), where each point represents one mitochondrion (nWT = 2464, n#1 = 3196 and n#2 = 2535 mitochondria). Outliers are depicted with black circles. Two-sided Mann–Whitney test was applied (p values (area) = 2 × 10⁻¹⁶ **** and (aspect ratio) = 2.9 × 10⁻⁹ and 2.8 × 10⁻⁹ ****). For density and content quantification mean and standard errors are indicated, where each point represents one confocal section (nWT = 5, n#1 = 6 and n#2 = 6 sections). After applying Shapiro–Wilk test for normality an unpaired two-sided Student’s test was applied (p values (density) = 0.28 and 0.76 and (content) = 0.0005 *** and 0.005 ***). d TEM micrographs of male adult WT (left) and M1BP-depleted (middle, right) DLM mitochondria. Scale bars represent 1 µm (larger views) and 200 nm (individual mitochondria). e Tomographic reconstruction of an inclusion (orange) and the IMM (blue) (to visualise the inclusion a part of the IMM was computationally removed). Six of the 633 slices from the reconstructed tomogram stack are shown with their respective stack position. Source data are provided as a Source data file.

