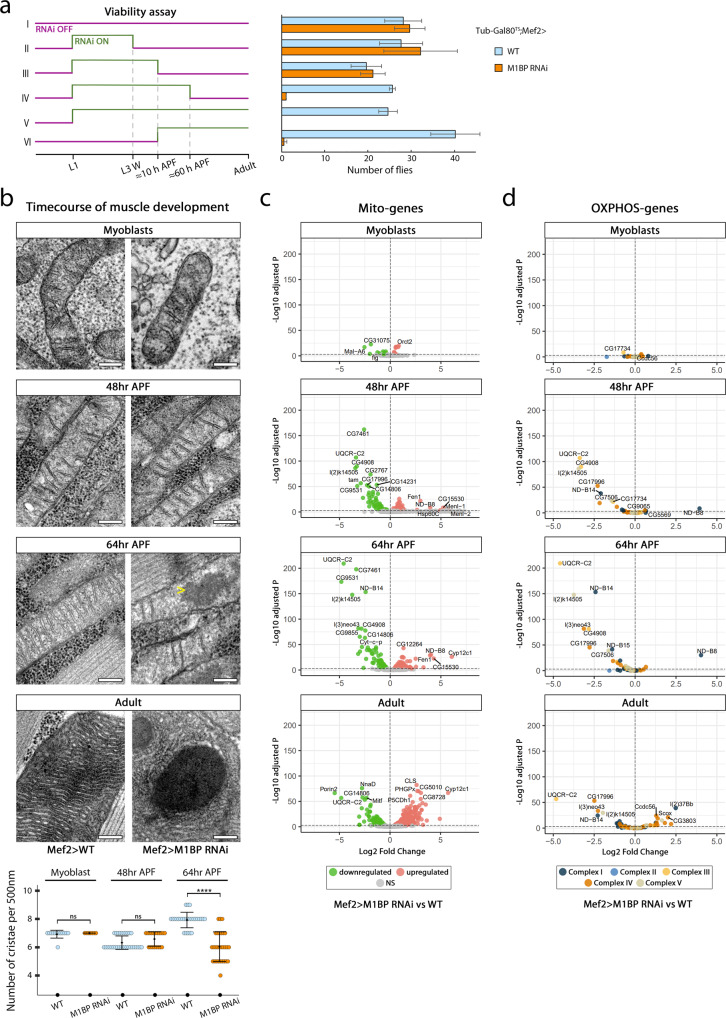
Fig. 3. M1BP regulates the expression of OXPHOS genes during flight muscle development.
a M1BP downregulation was temporally controlled using Mef2-GAL4 driven tub-Gal80ts transgene. For each condition, the mean and standard deviation of the number of adult flies (both sexes included) is represented resulting from two independent biological replicates. b Transmission electron microscopy micrographs of mitochondria from WT (left) and M1BP-depleted (right) myoblast and pupal flight muscles at 48 h and 64 h APF, using Mef2-GAL4 driver. Arrowhead highlights amorphous electron-dense inclusions visible in the matrix in 64 h APF preparations upon M1BP RNAi. Scale bars represent 200 nm. Quantification of cristae number per 500 nm is shown for each time point (n (MyoWT) = 12, n (MyoRNAi) = 8, n (48 hWT) = 29, n (48 hRNAi) = 15, n (64 hWT) = 15, n (64 hRNAi) = 28 mitochondria). After applying Shapiro-Wilk test for normality, two-sided Mann–Whitney test was applied (p values: Myo = 0.53; 48 h = 0.08; 64 h = 1.36 × 10⁻⁸ ****). c, d Volcano plots of all differentially expressed nuclear-encoded mitochondrial (c) or only OXPHOS-related (d) genes between Mef2>WT and Mef2 > M1BP RNAi at corresponding time points. For statistical analysis, the Wald test with Benjamini–Hochberg-correction was applied. Source data are provided as a Source data file.

