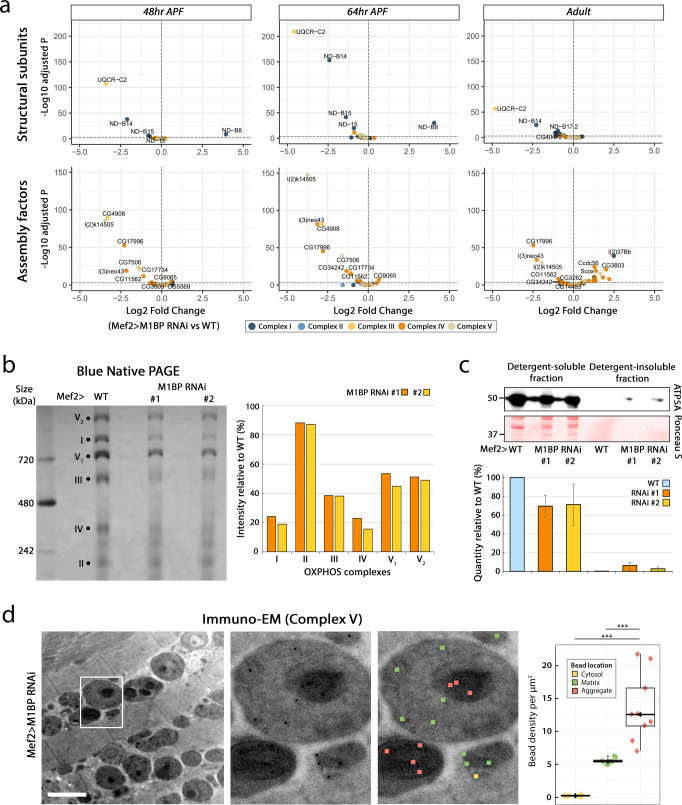
Fig. 5. M1BP KD leads to reduced mitochondrial respiratory complex assembly.
a Volcano plots of differential gene expression analyses between Mef2>WT and Mef2 > M1BP RNAi developing DLM. The top volcano plots represent genes encoding structural subunits and bottom plots assembly factors of mitochondria respiratory complexes. Genes are colour-coded accordingly to their complex membership. For statistical analysis, the Wald test with Benjamini–Hochberg-correction was applied. b Blue native polyacrylamide gel of mitochondrial complexes extracted from adult flight muscle mitochondria. Complexes are depicted by a black circle, V1 and V2 refer to the monomer and dimer of complex V, respectively. Quantifications of the intensity of bands, representative of the protein quantity for each complex are represented in the bar chart as a percentage relative to the WT. c Western Blot of ATP5A Complex V subunit on detergent-soluble and insoluble protein fractions from WT and M1BP-depleted adult purified mitochondria. The Ponceau S membrane staining is shown as a loading control. The mean band intensities are represented as histograms for each condition from two independent biological replicates. Protein size is indicated in kDa. d Representative transmission electron micrographs (with an enlarged view on the right, depicted by a white rectangle) of the ImmunoEM experiment using gold-conjugated secondary antibody targeting an anti-Complex V antibody. The gold conjugates were quantified with respect to their location. Data are represented in boxplots (median and quartiles) with whiskers (minimum to maximum), where each image gave rise to a single value of the density of beads for each of the three locations; n = 9 sections; total number of beads= 1048 in the matrix, 169 in the cytosol and 102 in aggregates. The scale bar corresponds to 2 µm. After applying non-parametric Kruskal–Wallis test the pairwise, two-sided Mann–Whitney test was used (p values = 0.0004 ***). Source data are provided as a Source data file.

