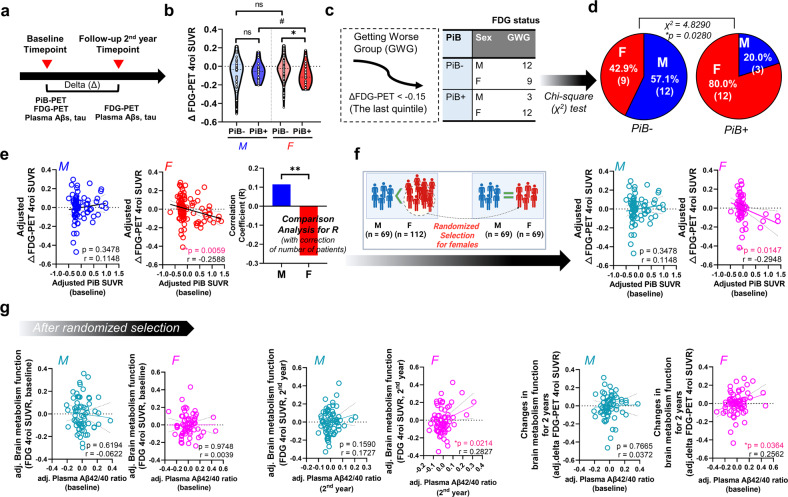
Fig. 2. Sex differences in the progression of brain hypometabolism in patients with AD and the relationship with the plasma beta-amyloid 42/40 ratio.
a Longitudinal study timeline. b Comparison of brain metabolism function at baseline and at a two-year follow-up between sexes. #P < 0.1 and *P < 0.05 as assessed using the two-sided independent-sample t test. c Patients in the last quintile (delta FDG-PET < −0.15 at the two-year follow-up) were placed in the worsening group. d Results of a chi-square test to compare the PiB-PET-negative (PiB–) and PiB-PET-positive (PiB+) subgroups of the worsening group (Getting worse group). There were more women in the PiB+ subgroup than in the PiB– subgroup. *P < 0.05 as assessed by the chi-square test. Delta indicates the difference between the first (baseline) and second (two-year follow-up) measurement values. e Sex differences in correlation patterns of brain metabolic status with cerebral amyloid deposition. **P < 0.01 as assessed using partial correlation analysis with age as a covariate. Correlation analysis corrected for the number of patients was also performed (**P < 0.01). f Sex differences in correlation patterns of brain metabolic status with cerebral amyloid deposition after performing randomized selection for women (*P < 0.05). g Sex differences in correlation patterns. Partial correlation analyses between the plasma beta-amyloid 42/40 ratio and FDG-PET SUVR (4 ROIs) after randomized selection of women were conducted. PiB-PET SUVR values and age were included as covariates. Delta indicates the difference between the first and second measurement values (*P < 0.05). See Supplementary Fig. 3 for all comparisons. Abbreviations: PiB-PET, Pittsburgh compound B-positron emission tomography; SUVR, standardized uptake value ratio; adj, adjusted.

