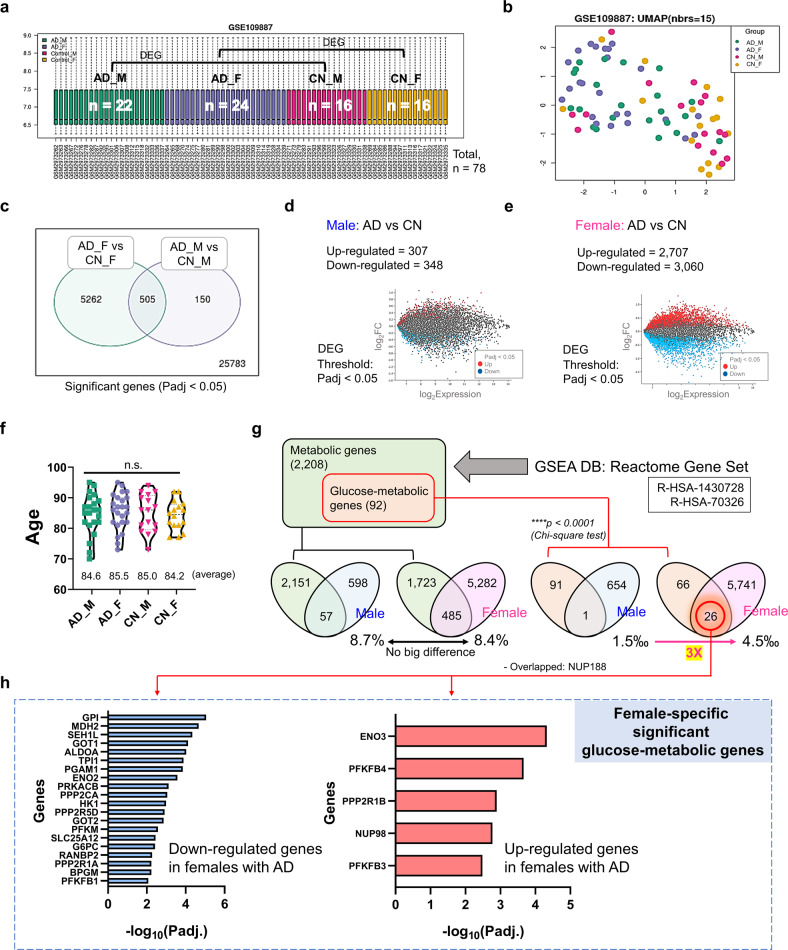
Fig. 3. Sex differences in the AD brain (middle temporal gyrus) in transcriptomic and metabolic changes.
a Gene expression distribution after normalization for RNA sequencing (boxplots show 3rd quartile + 1.5 IQR with upper whiskers and 1st quartile – 1.5 IQR of lower whiskers; Q1 (25th percentile) and Q3 (75th percentile) serve as the box bounds and Q2 (50th percentile) is the center bold line) of human brain (middle temporal gyrus) transcriptome data (16 CN men, 16 CN men, 22 men with AD, and 24 women with AD; n = 78) from the GEO2R public database (accession number: GSE109887; platform number: GPL10904). b Principal component analysis (PCA) plot showing transcriptomic expression patterns in RNA sequencing data. c The number of overlapping DEGs in male and female patients with AD. DEG threshold, FDR-adjusted P < 0.05. d The number of DEGs in male patients with AD. e The number of DEGs in female patients with AD. f There were no differences in age among groups. P values were obtained using a one-way ANOVA with post hoc tests. g The number of DEGs overlapping with metabolic genes or glucose-specific metabolic genes. Metabolic genes were selected by GSEA in the reactome gene set (R-HSA-1430728, R-HSA-70326). h Downregulated (20) and upregulated DEGs (6) in women with AD. F female, M male, Padj FDR-adjusted P value, DEG differentially expressed gene, GSEA gene-set enrichment analysis, DB database, CN cognitively normal.

