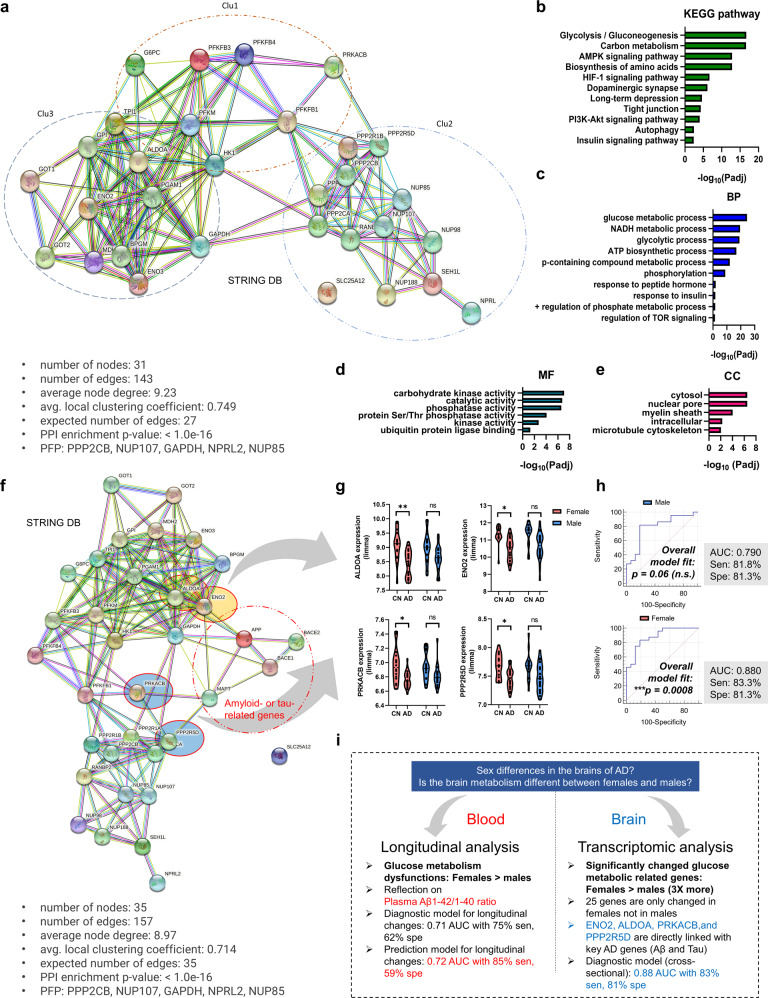
Fig. 4. Molecular network of a glucose-metabolic gene set specifically regulated in female AD patients (n = 25).
a A functional enrichment analysis to reveal protein‒protein interaction networks (31 nodes). Five proteins (PPP2CB, NUP107, GAPDH, NPRL2, and NUP85) were used as predicted functional partners (PFP) in the network model. Three clusters were detected by K-means clustering analysis. Colored nodes: query proteins and first shell of interactors; white nodes: second shell of interactors; filled nodes: some three-dimensional structures known or predicted; edges: protein‒protein associations. b–e Enriched KEGG pathways and gene ontology analysis (BP, CC, MF) using glucose metabolic genes specifically regulated in women. The analytic threshold of enrichment analyses was an FDR-adjusted P < 0.05. f A functional enrichment analysis to reveal protein‒protein interaction networks with key AD-related biomarker genes (APP, BACE1, BACE2, and MAPT; amyloid- or tau-related genes) (36 nodes). Five proteins (PPP2CB, NUP107, GAPDH, NPRL2, and NUP85) were used as predicted functional partners (PFP) in the network model. Colored nodes: query proteins and first shell of interactors; white nodes: second shell of interactors; filled nodes: some three-dimensional structures known or predicted; edges: protein‒protein associations. g mRNA expression of genes directly linked with key AD genes. Two-way ANOVA with Tukey’s post hoc test (cutoff: P < 0.01). h ROC curve analysis using the ALDOA, ENO2, PRKACB, and PPP2R5D genes. The logistic regression analysis showed significant results for women but not men. i Graphical summary of this study. Padj FDR-adjusted P values, DEG differentially expressed genes, BP biological process, CC cellular components, MF molecular functions, PFP predicted functional partners.

