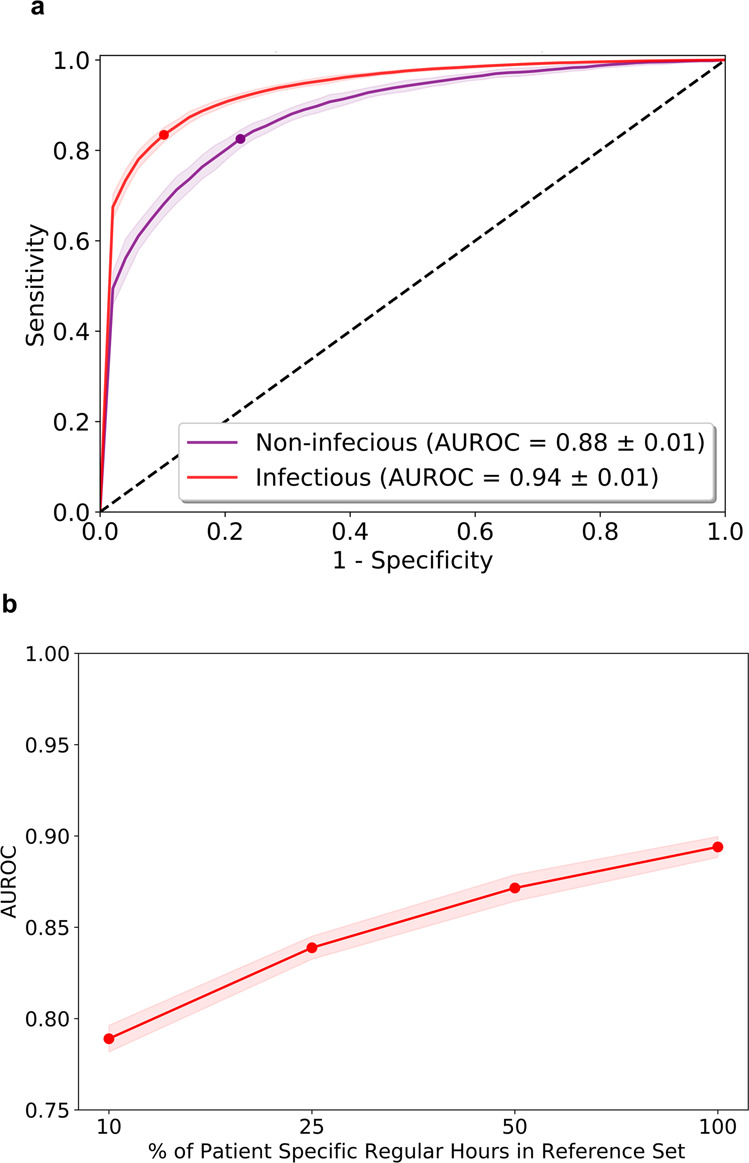
Fig. 2. Subanalysis of SCC-Score performance.

a Area under the Receiver Operating Characteristic curves (AUROC) using hourly SCC-Score with the patient-specific approach for infectious (red line) vs. non-infectious (purple line) for the total. Standard errors of the AUROC curves are computed from ten-fold cross-validation and show as shaded areas. b Performance of the SCC-Score with increasing percentage of specific regular hours in the reference set (red line).
