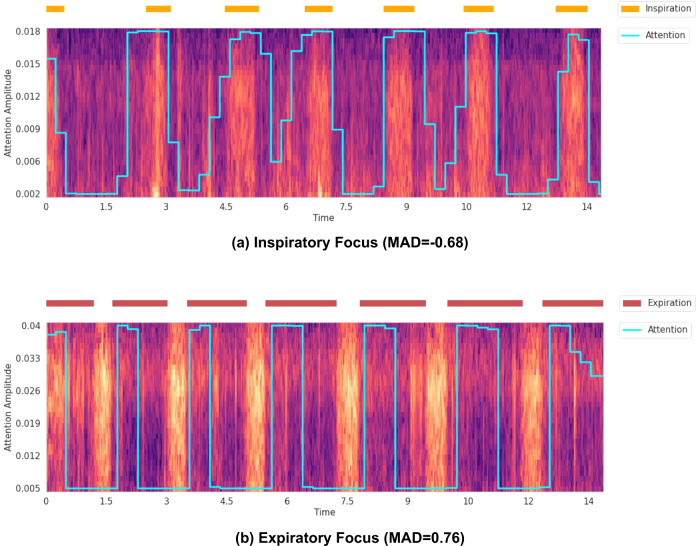
Fig. 3. Example attention curves, returned by the CNN classifier that discriminates healthy recordings from pathological ones.
The attention curves are overlaid on the recording spectrograms, which are given as inputs to the CNN classifier. Depending on the MAD value, either inspiration or expiration phases are provided as a reference. The respiration phases were extracted from the recording annotations. a The recording has a negative MAD, and its attention curve is shown with the inspiration phases. b The recording has a positive MAD, and its attention curve is shown with the expiration phases.

