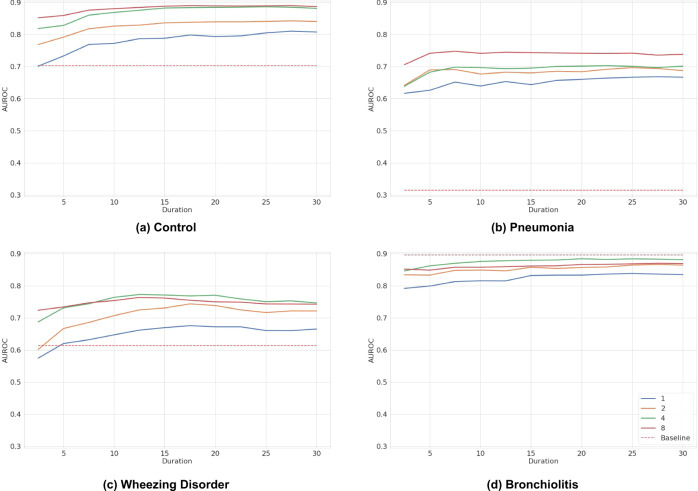
Fig. 4. Optimal duration and combination of inference audio.
Each graph represents a trained binary model for a Control, b Pneumonia, c Wheezing Disorders and d Bronchiolitis. Each solid line is the AUROC performance resulting from the external validation data comprising one of four combinations of anatomical positions (1, 2, 4 and 8). The AUROC is plotted over the duration of the test set samples in seconds ranging from 2.5 to 30. The dashed lines show the performances of the clinical baseline models that only use age and respiratory rate.

