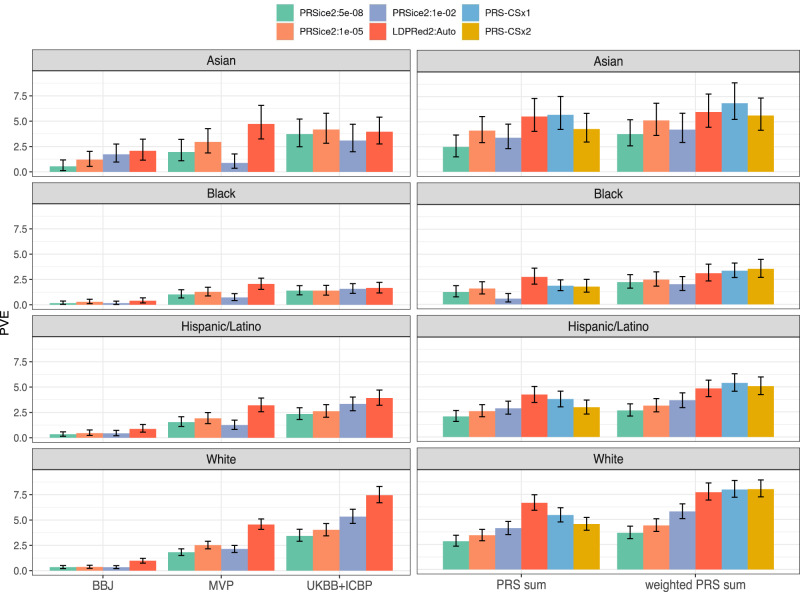
Fig. 2. SBP variance explained by compared SBP PRSs.
Estimated variance explained (PVE) by all compared SBP PRSs in the TOPMed-BP datasets (and UKBB Black individuals), stratified by race/ethnic background. The height of each bar represents the estimated PVE from association analysis of the PRS with SBP in the given stratum. Intervals represent the 95% confidence intervals based on the 2.5% and 97.5% distribution percentiles from bootstrap performed using unrelated individuals. The left column corresponds to PRSs constructed based on single GWAS, and the right column corresponds to PRS summation approaches. PRS-CSx1 and PRS-CSx2 refer to implementations of PRS-CS in which either MVP (PRS-CSx1) or COGENT (PRS-CSx2) GWAS summary statistics were used in place of an African ancestry GWAS. The sample sizes used in each of the analyses represented by the different bars in the figure are provided in Supplementary Table 5. BBJ Biobank Japan, GWAS genome-wide association study, LDPred Bayesian PRS method (LDPred2 denotes a specific software implementation of the LDPred algorithm), MVP Million Veteran Program, PRS-CSx continuous shrinkage cross-population PRS method, PRS polygenic risk score, PRSice2 software for computing PRS based on the clumping & thresholding methodology, PVE percent variant explained, SBP systolic blood pressure, TOPMed Trans-Omics for Precision Medicine, UKBB + ICBP United Kingdom biobank and the International Consortium of Blood Pressure.

