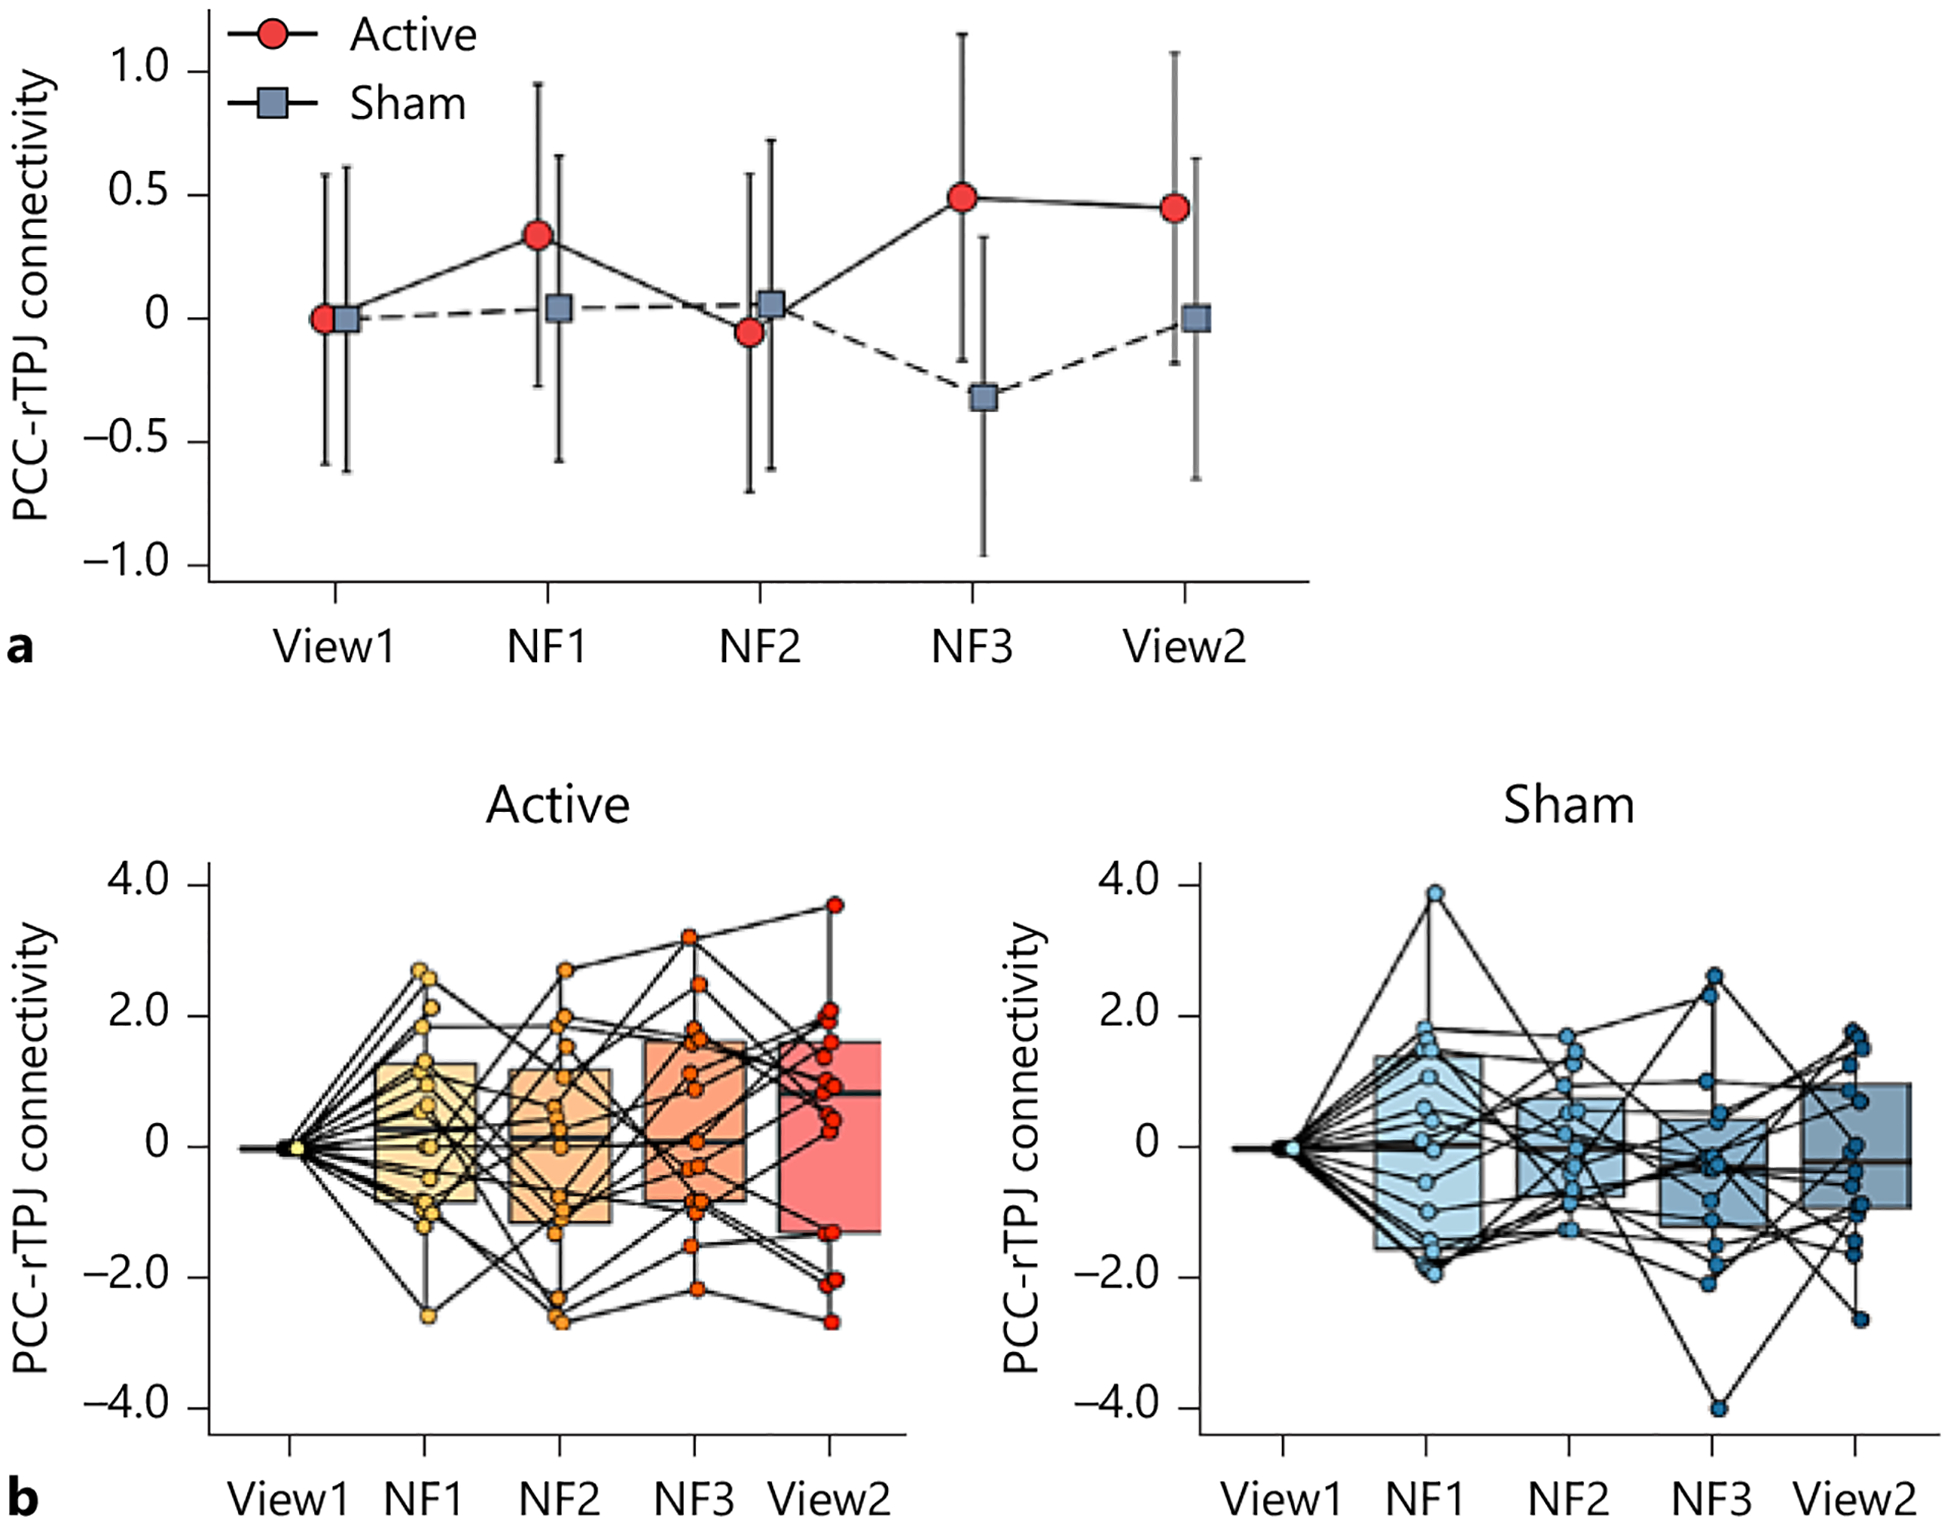
Fig. 2.

Longitudinal change in the primary neural outcome. a Change in gPPI estimates of the precuneus/posterior cingulate cortex (PCC) and the right temporoparietal junction (rTPJ) functional connectivity between the active and sham groups through the neurofeedback session. View1 and View2: no-neurofeedback run with a self-referential task, NF1, NF2, and NF3: neurofeedback run with a self-referential task. The error bars represent the 95% confidence interval of the mean values. b Boxplots and individual plots of the PCC-rTPJ connectivity. Left: active group, right: sham group.
