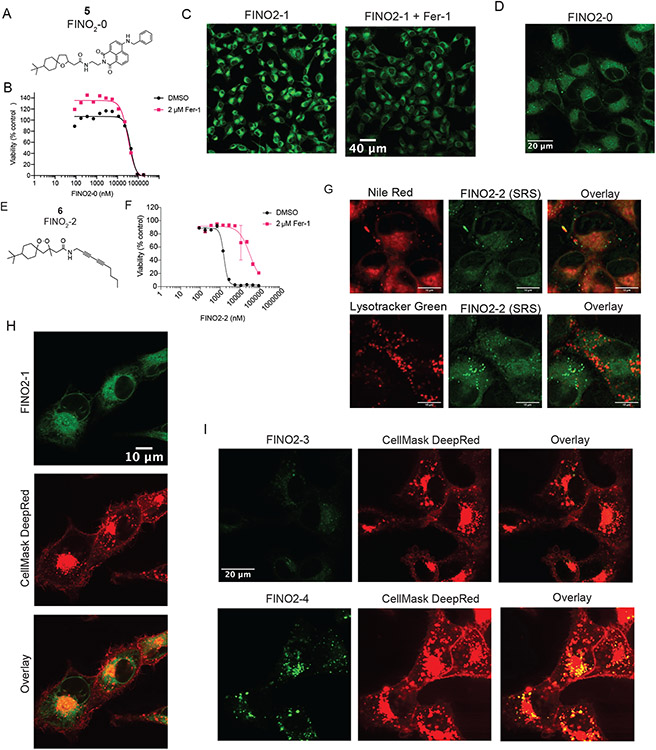
Extended Data Fig. 6. FINO2-0 and FINO2-2 accumulate in the ER, and FINO2-1/FINO2-3/FINO2-4 do not accumulate in the plasma membrane.
A. Structure of FINO2-0. B. Dose-response curve of HT-1080 cells treated with FINO2-0 ± fer-1. Data are represented as mean ± SEM, n=3. C. Confocal fluorescence images of HT-1080 cells treated for 3 hours with 3 μM FINO2-1 alone or with 3 μM fer-1. D. Confocal fluorescence image of HT-1080 cells treated with 3 μM FINO2-0. F. Confocal fluorescence imaging of HT-1080 cells treated with FINO2-1 (3 μM) and fer-1 (3 μM) for 3 hours, co-stained with BODIPY TR ceramide. G. Structure of FINO2-2. H. Dose-response curve of HT-1080 cells treated with FINO2-2 ± fer-1. Data are represented as mean ± SEM, n=3. I. SRS and fluorescence imaging of HT-1080 cells treated with 20 μM FINO2-2 and 2 μM fer-1, and stained with Nile Red and Lysotracker green. J. Confocal fluorescence image of HT-1080 cells treated with 3 μM FINO2-1 and 3 μM fer-1, and costained with CellMask Deep Red. K. Confocal fluorescence image of HT-1080 cells treated with 3 μM FINO2-3 or 3 μM FINO2-4, and 3 μM fer-1, and co-stained with CellMask Deep Red.

