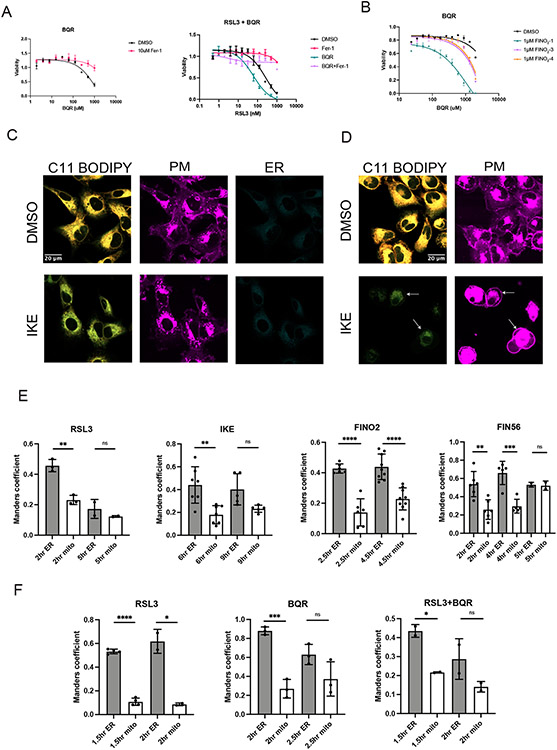
Extended Data Fig. 8. Ferroptosis induced by DHODH inhibition is amplified by ER peroxidation, ferroptosis induced by IKE results in ER membrane peroxidation followed by PM peroxidation, early perinuclear lipid peroxidation occurs in the ER.
A. Brequinar (BQR) induces ferroptosis in HT1080s as rescued by fer-1, and cotreatment with BQR (500 μM) increases sensitivity to RSL3 in HT1080s. Data are represented as mean ± SEM, n=3. B. Dose-response curve of HT1080 cells cotreated with 1 μM of FINO2-1, FINO2-3, or FINO2-4. Data are represented as mean ± SEM, n=3. C. HT-1080 cells treated with DMSO or IKE (10 μM) for 6 hours and stained with C11 BODIPY (oxidized and reduced overlay), CellMask Deep Red, and ERTracker Blue-White. D. HT-1080 cells treated with DMSO or IKE (10 μM) for 10 hours and stained with C11 BODIPY (oxidized and reduced overlay), CellMask Deep Red, and ERTracker Blue-White. E. Correlation (Manders coefficient) of C11 BODIPY oxidized signal with ERTracker Blue-White or MitoTracker Deep Red in HT1080 cells treated with either RSL3, IKE, FINO2, or FIN56 at designated timepoints. Data are represented as mean ± SEM, each individual point represents an image of multiple cells. Number of images for each condition are RSL3 2 hour (n=3), 5 hour (n=2); IKE 2 hour (n=7), 5 hour (n=5), FINO2 2.5 hour (n=6), 4.5 hour (n=9), FIN56 2 hour (n=6), 4 hour (n=5), 5 hour (n=2). Ordinary one way ANOVA with Tukey’s test for multiple comparisons was used with p values of: RSL3 (0.0016, 0.6120), IKE (0.0023, 0.1279), FINO2 (<0.0001, <0.0001), FIN56 (0.0034, 0.0005, >0.9999). F. Correlation (Manders coefficient) of C11 BODIPY oxidized signal with ERTracker Blue-White or MitoTracker Deep Red in HT1080 cells treated with either RSL3 (1 μM), BQR (1 mM) or both at designated timepoints. Data are represented as mean ± SEM, each individual point represents an image of multiple cells. Number of images for each condition are RSL3 1.5 hour (n=4), 2 hour (n=2); BQR 2 hour (n=3), 2.5 hour (n=3); RSL3 + BQR 1.5 hour (n=2), 2 hour (n=2). Two-sided unpaired t test was used with p values of: RSL3 (<0.0001, 0.0178), BQR (0.0006, 0.1011), RSL3 + BQR (0.0117, 0.2027). For all panels, GraphPad Prism (GP) P value style of 0.1234 (ns), 0.0332 (*), 0.0021 (**), 0.0002 (***), <0.0001 (****).

