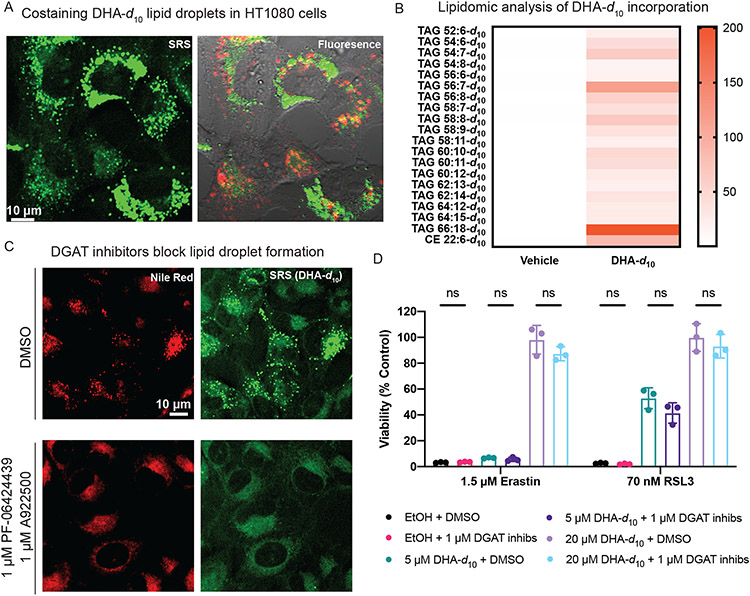
Figure 2. D-PUFA accumulation in lipid droplets does not play a role in inhibition of ferroptosis.
A. SRS and fluorescence imaging of HT-1080 cells treated with 20 μM DHA-d10, and then stained with Nile Red (shown in green for consistency with SRS image) and Lysotracker Green (in red). B. Heatmap showing relative incorporation of deuterated DHA into HT-1080 triglycerides, as measured by LC-MS. Vehicle showed no deuterated incorporation, whereas DHA-d10 had varying levels of incorporation into triglycerides and cholesterol esters, with different sum total numbers of carbons and double bonds. Data shown are an average of absolute signal intensity of three biological replicates. C. SRS and fluorescence imaging of HT-1080 cells treated with DHA-d10 (20 μM) ± cotreatment with DGAT inhibitors PF-06424439 (1 μM) and A922500 (1 μM), and then stained with Nile Red. D. Rescue of HT-1080 cells from erastin or RSL3 lethality with pre-treatment of DHA-d10 ± co-treatment of DGAT inhibitors. Data are represented as mean ± SEM, along with individual data points, n=3. Statistics performed using two-sided unpaired t test.

