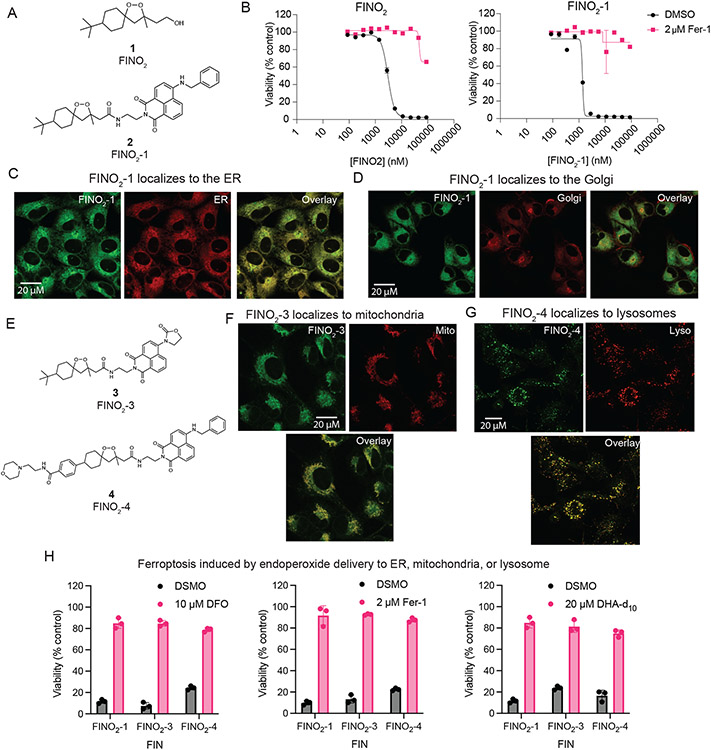
Figure 5. FINO2 analogs can induce ferroptosis through accumulation in the ER, lysosome, or mitochondria.
A. Structures of FINO2 and analog FINO2-1 with an added fluorescent naphthalimide label. B. Dose response curves of FINO2 and FINO2-1, ± fer-1 (2 μM). Data are represented as a mean ± SEM, n=3. C. Confocal fluorescence imaging of HT-1080 cells treated with FINO2-1 (3 μM) and fer-1 (3 μM) for 3 hours, co-stained with ERTracker Red. D. Confocal fluorescence imaging of HT-1080 cells treated with FINO2-1 (3 μM) and fer-1 (3 μM) for 3 hours, co-stained with BODIPY TR ceramide. E. Structures of FINO2analogs FINO2-3 and FINO2-4. F. Confocal fluorescence imaging of HT-1080 cells treated with FINO2-3 (3 μM) and fer-1 (3 μM) for 3 hours, co-stained with MitoTracker Red CMXRos. G. Confocal fluorescence imaging of HT-1080 cells treated with FINO2-4 (3 μM) and fer-1 (3 μM) for 3 hours, co-stained with LysoTracker Red. H. Rescue of HT-1080 cells treated for 24 hours with FINO2-1 (2.5 μM), FINO2-3 (5 μM), or FINO2-4 (5 μM) by DFO (left, 10 μM cotreatment), fer-1 (center, 2 μM cotreatment), or DHA-d10 (right, 20 μM 24-hour pretreatment). Data are represented as mean ± SEM, n=3 biologically independent samples.

