
Figure 5:
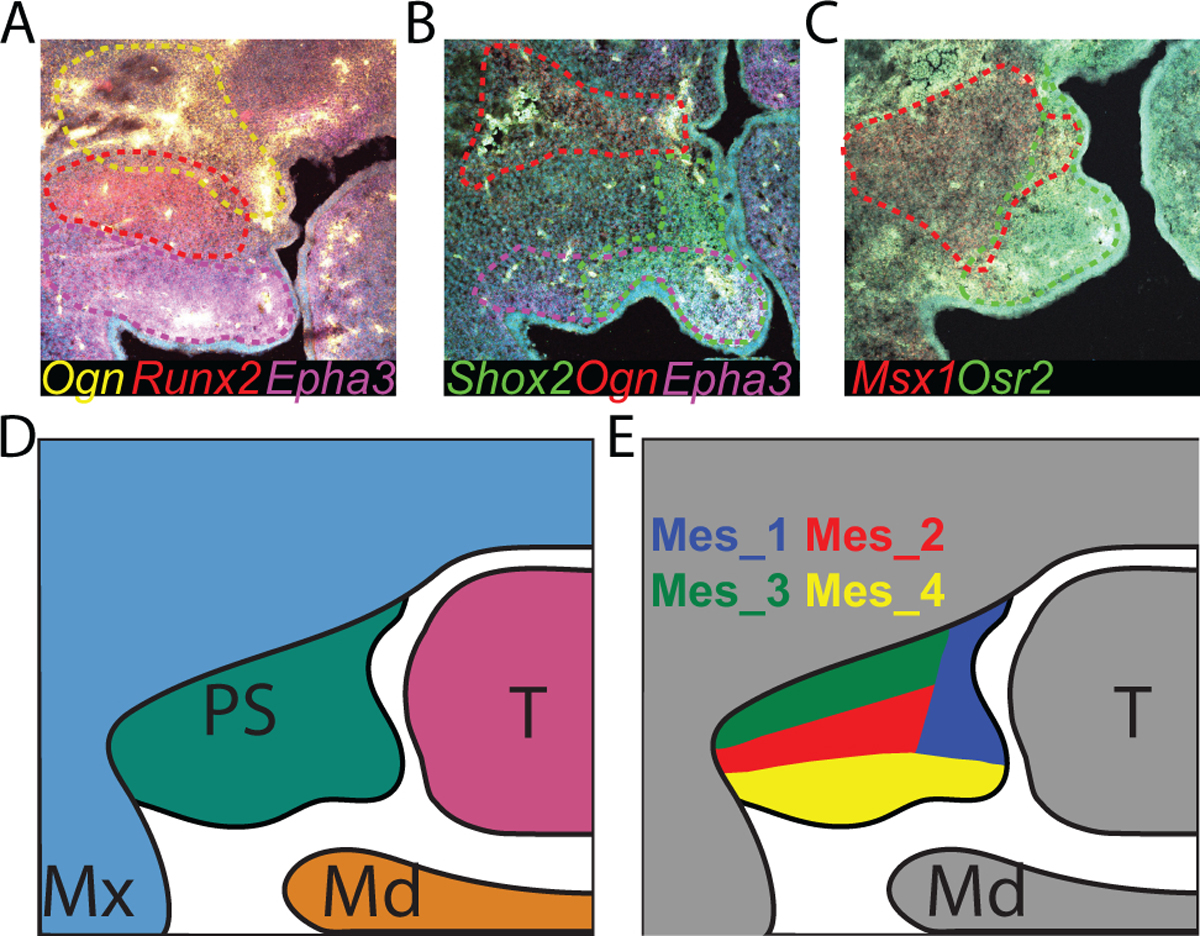
HCR RNA FISH of Ogn, Runx2, and Epha3 (A), Shox2, Ogn, and Epha3 (B), and Msx1 and Osr2 (C) shows reproducible boundaries of cluster-specific expression domains. D) A schematic shows proposed subdomains of each palate mesenchyme cell population. Mes subdomains are color coded to match clusters in UMAP in Figure 2A. PS=Palatal Shelf, Mx=Maxilla, Md=Mandible, T=Tongue.