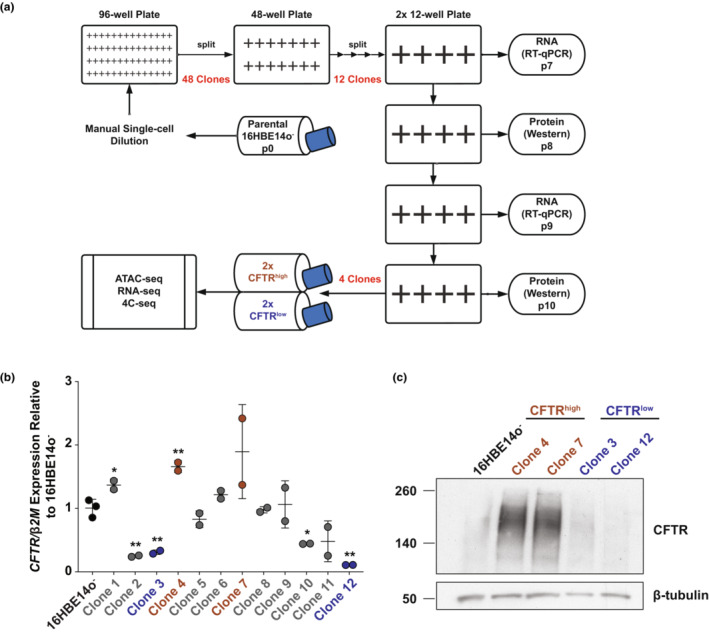
FIGURE 1.

16HBE14o− cell line contains two subpopulations expressing differing amounts of CFTR transcript and protein. (a) Schema illustrates the generation of 16HBE14o− clones from single cells following manual dilution and subsequent analyses. (b) CFTR expression normalized to β2M, shown relative to 16HBE14o− WT cells (n = 2). Cells at two non‐sequential passages were evaluated for 12 clones, with the four identified for subsequent analyses shown in brown (CFTRhigh) or blue (CFTRlow). ** denotes p < 0.01 and * denotes p < 0.05, compared to 16HBE14o− using unpaired t‐tests with Welch's correction. (c) Western blot showing CFTR protein levels with an antibody specific for CFTR in 16HBE14o− cells and two clones each of CFTRhigh and CFTRlow cells. β‐tubulin provides the loading control. The data shown are representative of the two separate passages surveyed.
