FIGURE 4.

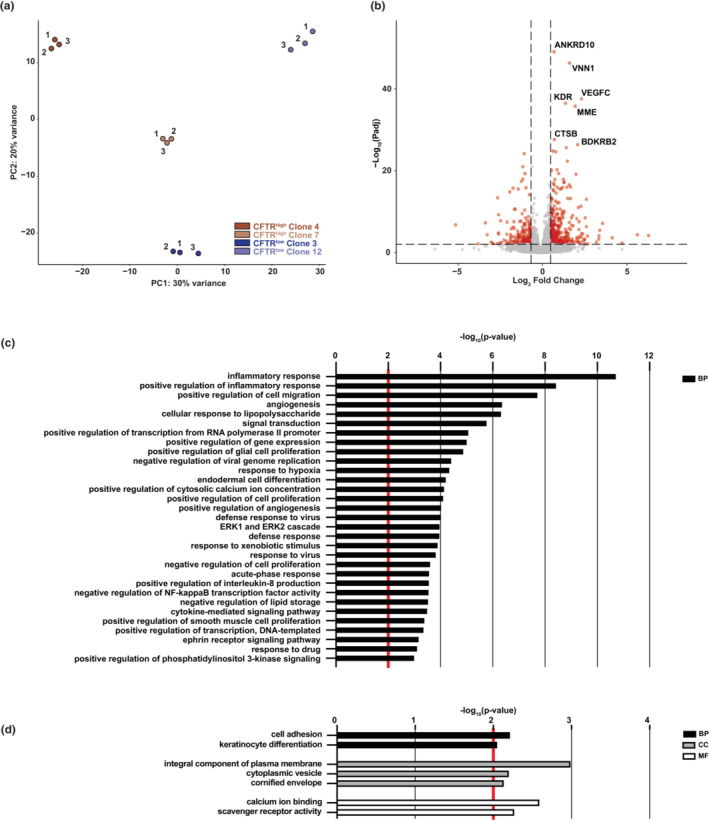
Transcriptomic differences of CFTRhigh and CFTRlow cells. (a) Principal component analysis (PCA) plot comparing RNA‐seq data from individual replicates of CFTRhigh and CFTRlow clones (n = 3 of each). (b) Volcano plot of RNA‐seq data comparing CFTRhigh and CFTRlow cells (−log10 adjusted p‐value vs. log2 fold change) with genes upregulated in CFTRlow and in CFTRhigh cells shown to the left and right, respectively. Shown in red are genes with an absolute fold change of ≥1.5 and an adjusted p‐value of ≤0.01. (c,d) Gene ontology process enrichment analysis of 311 genes upregulated in CFTRhigh cells (c) and 169 genes upregulated in CFTRlow cells (d), when comparing CFTRhigh and CFTRlow. Terms with a p‐value of ≤0.01 (denoted by red line) for biological process (BP), cellular component (CC), and molecular function (MF) are shown, with only the top 20 biological process (BP) terms listed in (c).
