
Figure 3.
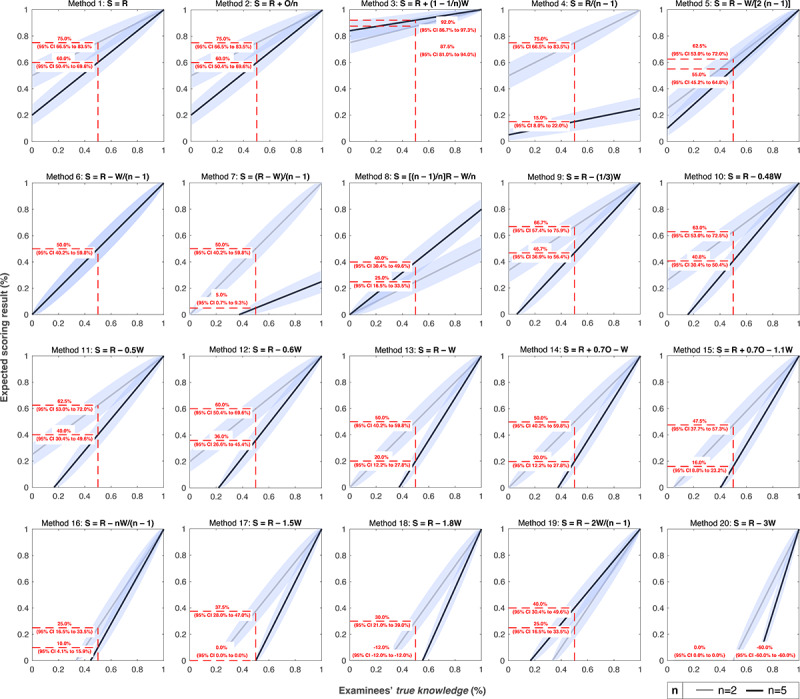
Relation between examinees’ true knowledge (%) and the expected scoring results for examinations with 100 single-choice items (either n=2 or n=5 answer options per item). In each case, the expected scoring result at 50% true knowledge is shown with the associated 95% confidence interval. Method 21 is not shown because the relation depends on the proportion of single true-false items with true or false statements. O: number of omitted items (O=0); R: number of correct responses; S: examination result as absolute score (max. up to 100 points); W: number of incorrect responses.