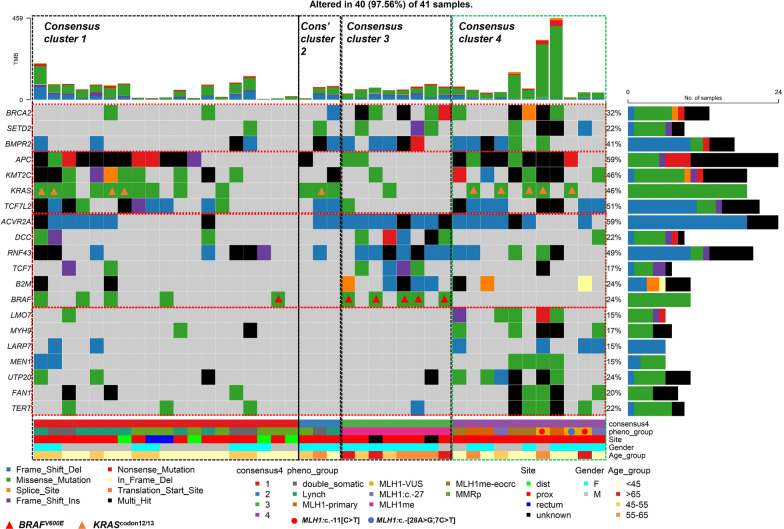
Fig. 4.
Somatic mutational “oncoplot” showing differential mutational patterns by Consensus Clusters as defined by genome-wide DNA methylation. Somatic mutational profiles of 20 novel genes, including 3 genes associated with Consensus Cluster 3, 10 genes associated with Consensus Cluster 3 and 7 genes associated with Consensus Cluster 4 are shown. The samples are shown in vertical lines and ordered by CRC subgroup and their Consensus Clusters. The total mutational burden (TMB) shows the accumulative numbers of somatic mutations identified in each tumour sample. Individual tumour samples are further annotated by CRC subgroup, anatomical location, gender and CRC diagnosis age (years). The different types of somatic mutations are shown in different colours, and the compositional barplots illustrate the total loads of somatic mutations separated by the nucleotide changes

