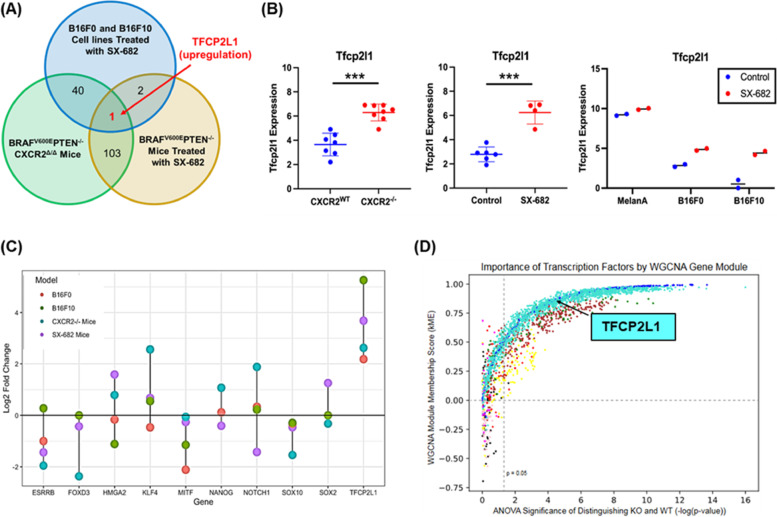
Fig. 7.
Tfcp2l1 is commonly upregulated across three models of CXCR2 perturbation. a, b In comparing expression data from BrafV600E/Pten−/−/Cxcr2−/− tumors. BrafV600E/Pten−/− tumors treated with SX-682, and B16F0 and B16F10 cell lines treated with SX-682, Tfcp2l1 was consistently upregulated compared to appropriate controls (as determined by Welch's t-test). c Log2 fold change for Tfcp2l1 and related genes across experimental groups based upon RNAseq analysis. d Identification of transcription factors central to Weighted Correlation Network Analysis (WGCNA) co-expressed gene modules (by kME) and significantly differentially expressed between BrafV600E/Pten−/−/Cxcr2−/− and BrafV600E/Pten−/−/Cxcr2WT tumors. TFs are colored by gene module and show varying levels of centrality to each module and importance in distinguishing WT and KO tumors. Turquoise dots represent transcription factors that are up in the BrafV600E/Pten−/−/Cxcr2−/− tumors and blue dots represent transcription factors that are up in the BrafV600E/Pten−/−/Cxcr2WT tumors

