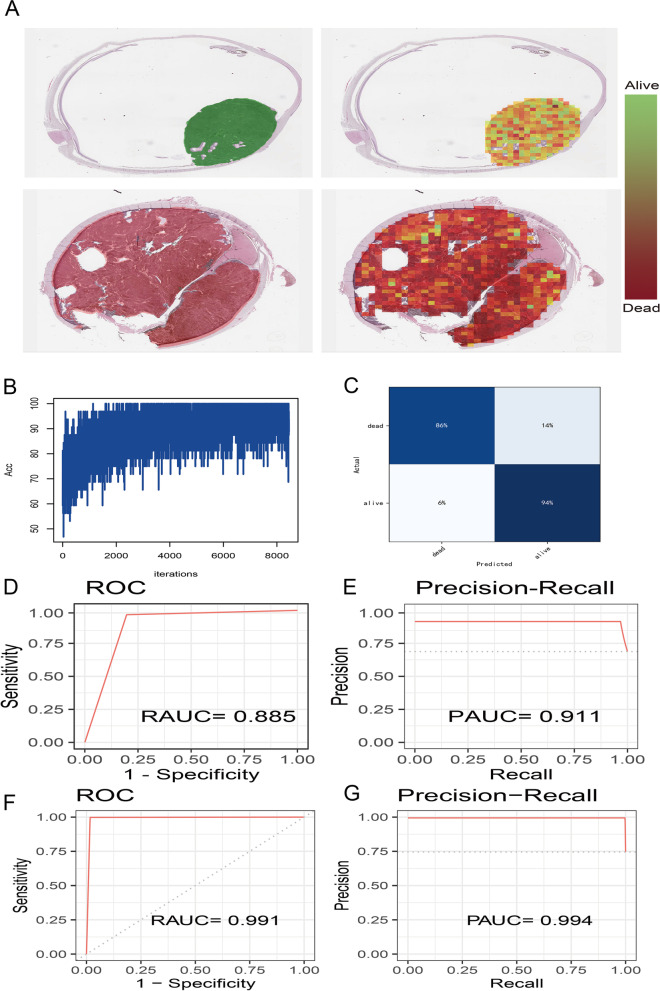
Fig. 2.
The deep learning (Google-net) model for patches prediction. A Probably heatmaps of alive and dead status at the stage of patches prediction. The color bars represent the vital status probability of each patch. B The accuracy curve of deep learning model training. C The confusion matrix of deep learning model. D The ROC curve and AUC value (RAUC) of deep learning model in TCGA-UVM cohort. E The Precision-Recall curve and AUC value (PAUC) of deep learning model in TCGA-UVM cohort. F The RAUC of deep learning model in HX cohort. G The PAUC of deep learning model in HX cohort

