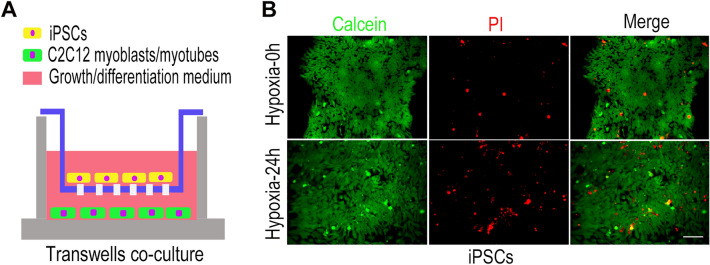
Fig. 2.
iPSCs co-culture model construction. A Transwell co-culture model with iPSCs cultured in a transwell insert, and C2C12 myoblasts cultured in a 6-well plate with the growth or differentiation medium of C2C12 myoblasts. B Cellular activity of iPSCs in C2C12 myoblasts growth medium before and after exposure to hypoxia for 24 h, where Calcein (green) indicates live cells and PI (red) indicates dead cells. Statistics were from three independent replicates of the samples and data were expressed as mean ± SEM; the remaining two groups were compared with the hypoxic group, respectively, and P values are the results of one-way ANOVA. *P < 0.05, **P < 0.01, ***P < 0.001. ns, no significant difference. Scale bar = 100 μm. PI: Propidium iodide

