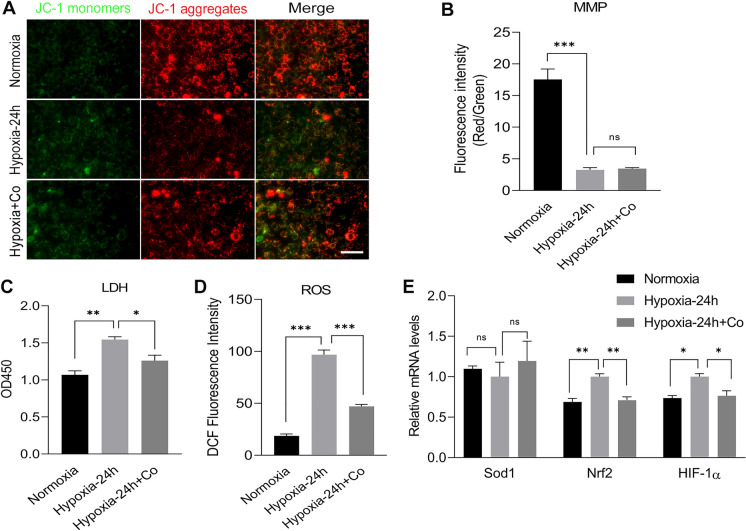
Fig. 3.
iPSCs enhanced the activity of C2C12 myoblasts under hypoxic damage. A, B Immunofluorescence staining showing the mitochondrial membrane potential of C2C12 myoblasts and the mean fluorescence intensity integral ratio of red–green fluorescence of mitochondrial membrane potential of C2C12 myoblasts after exposure to normoxia or hypoxia for 24 h with or without iPSCs co-culture. C Absorbance of LDH measured at 450 nm in C2C12 myoblasts medium supernatants after exposure to normoxia or hypoxia for 24 h with or without iPSCs co-culture. D Average fluorescence intensity integral values of ROS of C2C12 myoblasts after exposure to normoxia or hypoxia for 24 h with or without iPSCs co-culture. E Results of qPCR analysis showing the mRNA levels of Sod2, Nrf2, and HIF1 after after exposure to normoxia or hypoxia for 24 h with or without iPSCs co-culture. Statistics were from three independent replicates of the samples and data were expressed as mean ± SEM; the remaining two groups were compared with the hypoxic group, respectively, and P values are the results of one-way ANOVA. *P < 0.05, **P < 0.01, ***P < 0.001. ns, no significant difference. Scale bar = 100 μm. Co: iPSCs and C2C12 co-culture. MMP: Mitochondrial membrane potential. LDH: Lactate dehydrogenase. ROS: Reactive oxygen species

