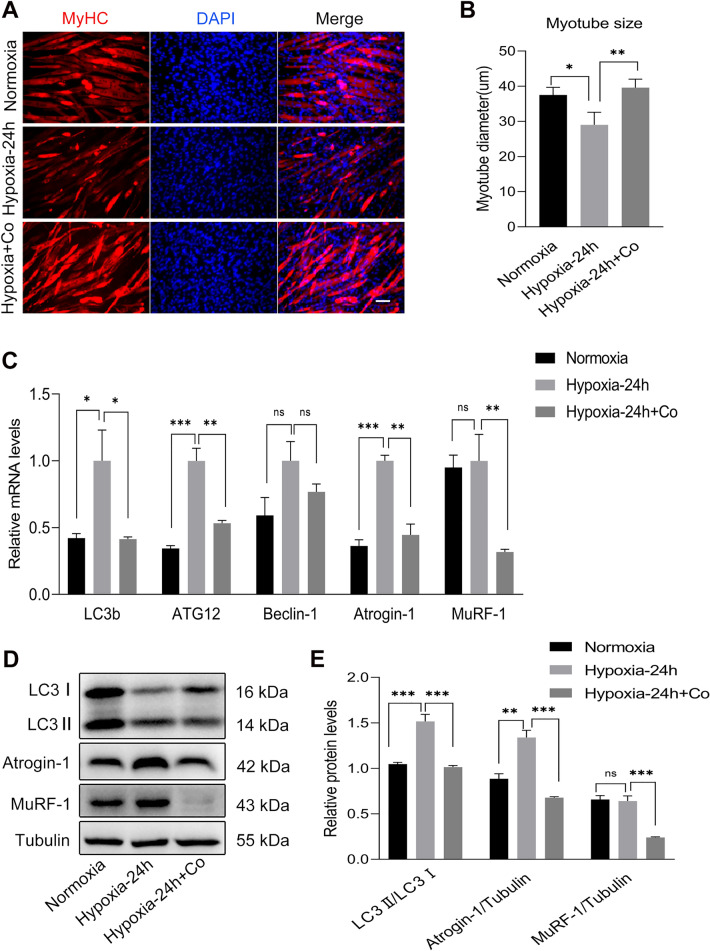
Fig. 6.
iPSCs improved the autophagy and atrophy in C2C12 myotubes under hypoxia. A Immunofluorescence staining showing MyHC expression in C2C12 myotubes after exposure to normoxia or hypoxia for 24 h with or without iPSCs co-culture. (red, MyHC; blue, DAPI). B Statistical analysis of the maximum diameter of MyHC-positive myotubes. C qPCR analysis results showing the mRNA levels of autophagy- and atrophy-related markers in C2C12 myotubes after exposure to normoxia or hypoxia for 24 h with or without iPSCs co-culture. D, E Western blot results showing the protein levels of autophagy- and atrophy-related markers in C2C12 myotubes after exposure to normoxia or hypoxia for 24 h with or without iPSCs co-culture. Statistics were from three independent replicates of the samples and data were expressed as mean ± SEM; the remaining two groups were compared with the hypoxic group, respectively, and P values are the results of one-way ANOVA. *P < 0.05, **P < 0.01, ***P < 0.001. ns, no significant difference. Scale bar = 100 μm. Co: iPSCs and C2C12 co-culture

