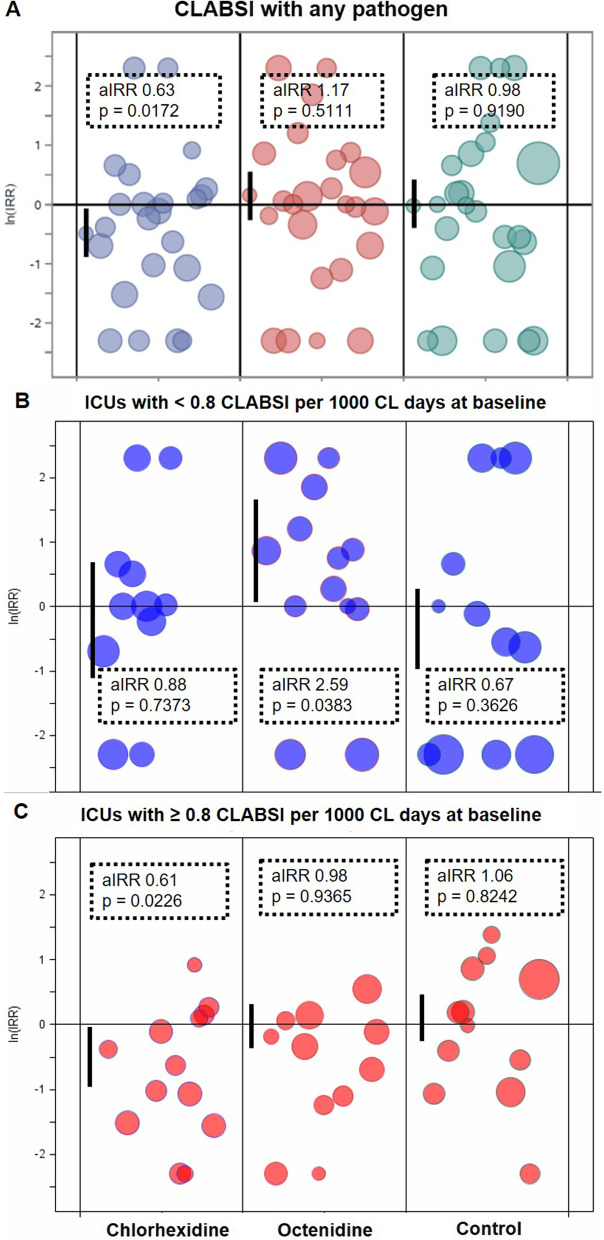
Fig. 3.
Effect of trial interventions on CLABSI with any pathogen for all ICUs (A), for ICUs < 0.8 CLABSI per 1000 CL-days at baseline (B) and ICUs with ≥ 0.8 CLABSI per 1000 CL-days (C) visualised by study group. Logarithmised incidence rate ratios (ln(IRR)) are depicted for CLABSI with any pathogen. Results are based on unadjusted Poisson regression models (IRR) for single ICUs and adjusted GEE models (aIRR) for study groups (first bubble per group) with 95% confidence intervals (indicated by vertical lines). P values were given for type III test. The sizes of bubbles represent the number of CL days from the individual ICU relative to their group effect. For wards that did not observe any case of CLABSI in the baseline or intervention period the IRR was set to 10 (ln(10) = 2.3) and 0.1 (ln(1/10) = − 2.3), respectively. For the logarithmised incidence rate ratios, equal distances to ZERO (= no effect) in positive or negative directions have the same effect sizes in opposite directions. aIRR adjusted incidence rate ratio, CL central line (central venous catheter), ICU intensive care unit, IRR incidence rate ratio

