
Figure 1. Redistribution of FOXA1 in ESR1 mutant cells is associated with altered ER-FOXA1 interaction.
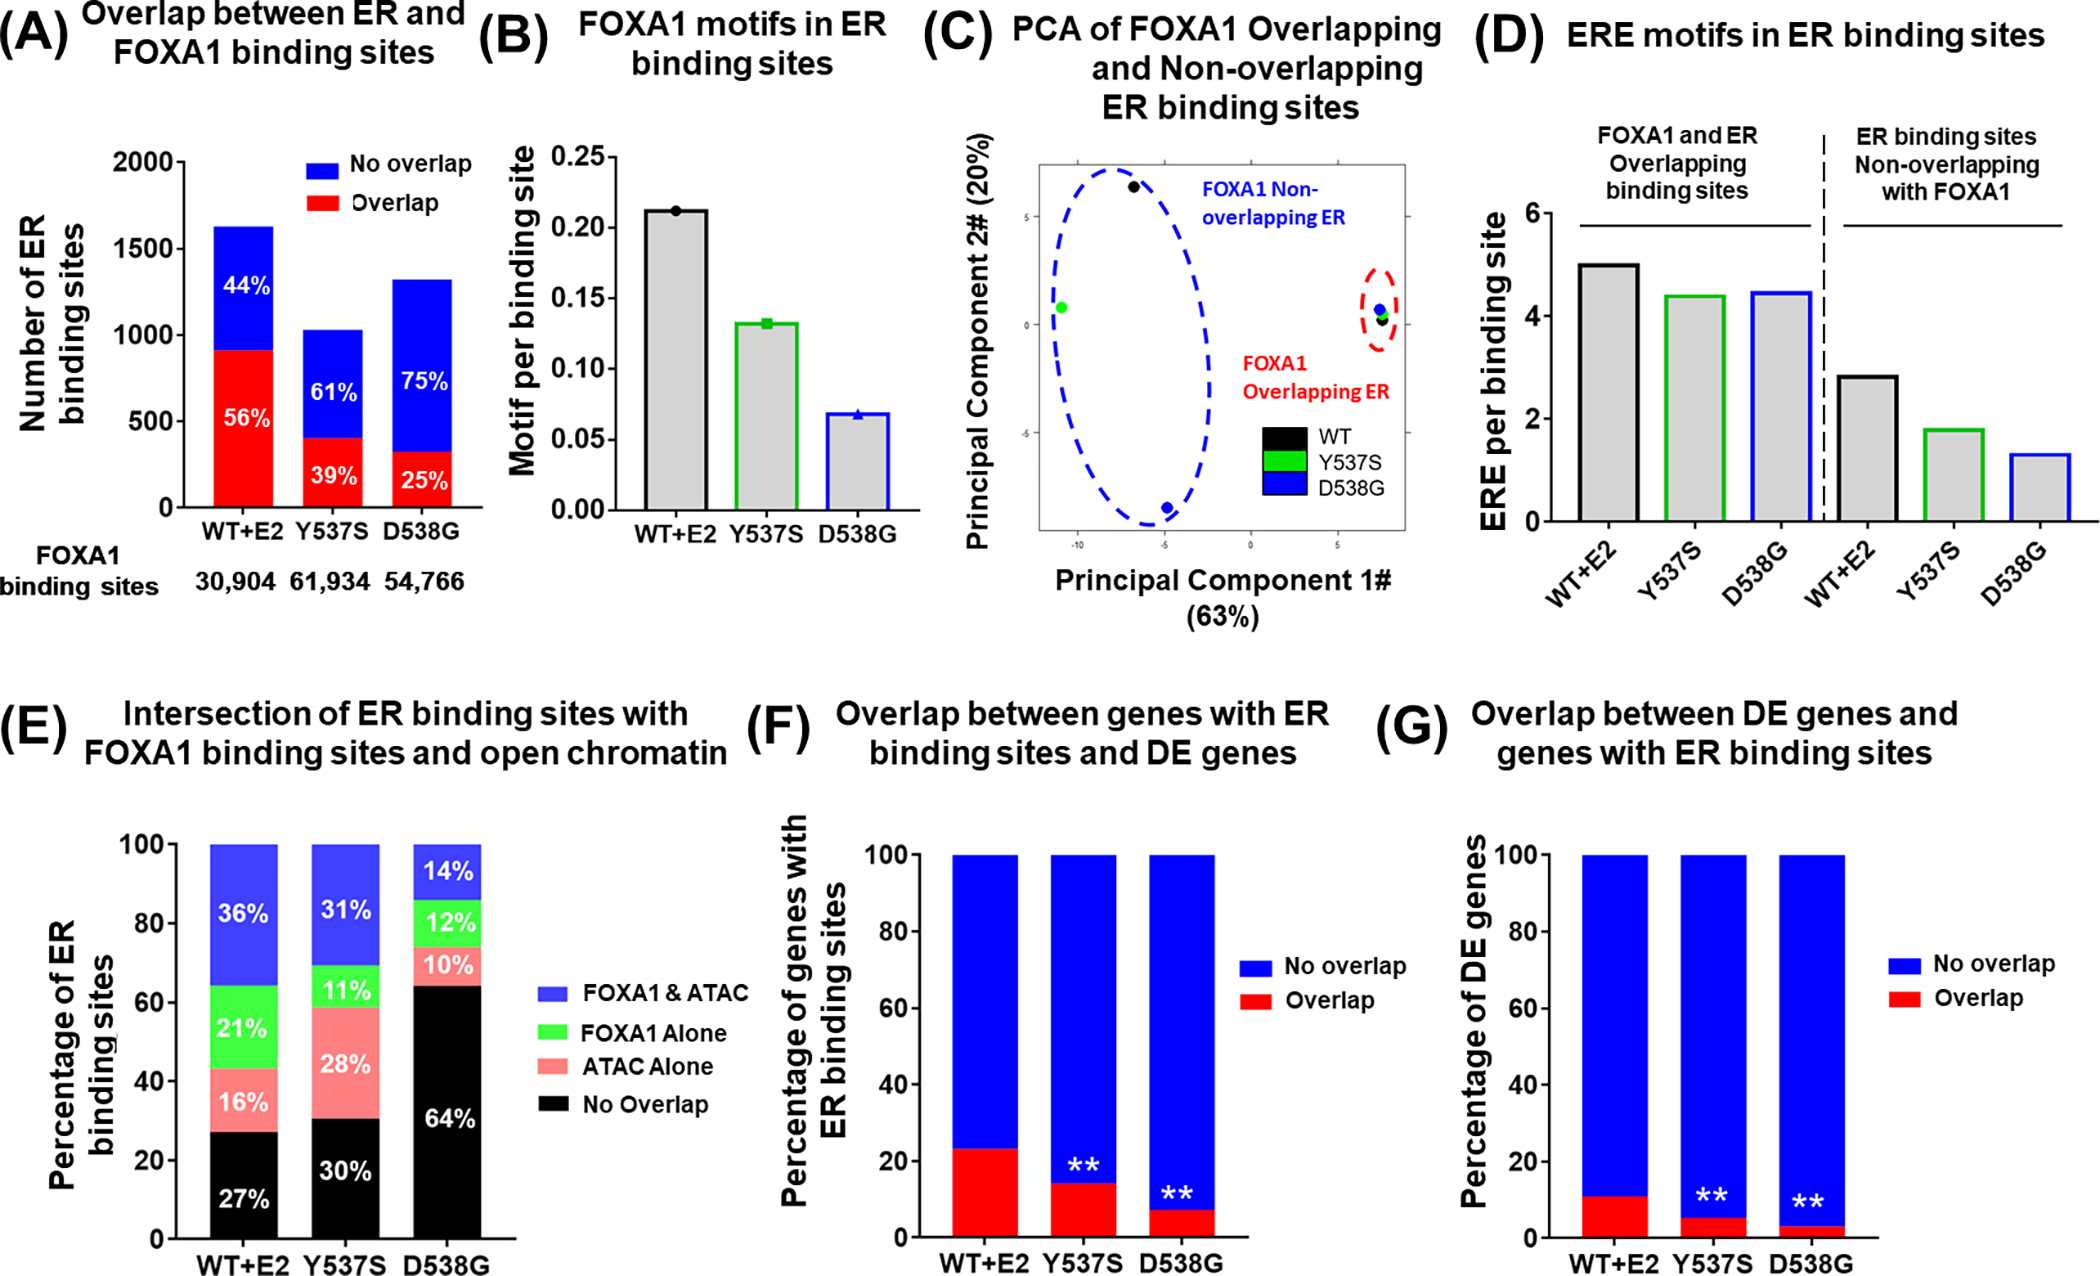
(A) Stacked bar plot showing the intersection of ER and FOXA1 binding sites in Oesterreich T47D cells. Percentages of each group of ER binding sites were indicated on each bar. Number of ER binding sites was shown on Y-axis, and number of total FOXA1 binding sites was shown below X-axis. Fisher’s exact test was performed to compare the overlapped part between WT and mutant cells.
(B) Bar plot representing the percentage of FOXA1 motifs present in the ER binding sites in Oesterreich T47D cells.
(C) PCA plot showing the similarity among FOXA1 Overlappping ER and FOXA1 Non- Overlapping ER binding sites in T47D ESR1 WT and mutant models.
(D) Bar plot comparing ERE motif occurrence per binding site among FOXA1 Overlappping ER and FOXA1 Non-overlapping ER binding sites in T47D ESR1 WT and mutant models.
(E) Stacked bar plot showing the intersection of ER peaks with FOXA1 and ATAC peaks, Percentages of each group of ER peaks are indicated on each bar.
(F, G) Stacked bar plot representing the intersection between ER binding sites annotated genes and differentially expressed genes. F) shows the percentage of ER binding sites annotated genes which have overlap with differentially expressed genes, G) shows the percentage of differentially expressed genes which have overlap with ER binding sites annotated genes. Fisher’s exact test was performed to compare the overlapped part between WT and mutant cells. (** p<0.01)