
Figure 3. ESR1 mutant cells show stronger response to RXR agonist LG268 promoted survival.
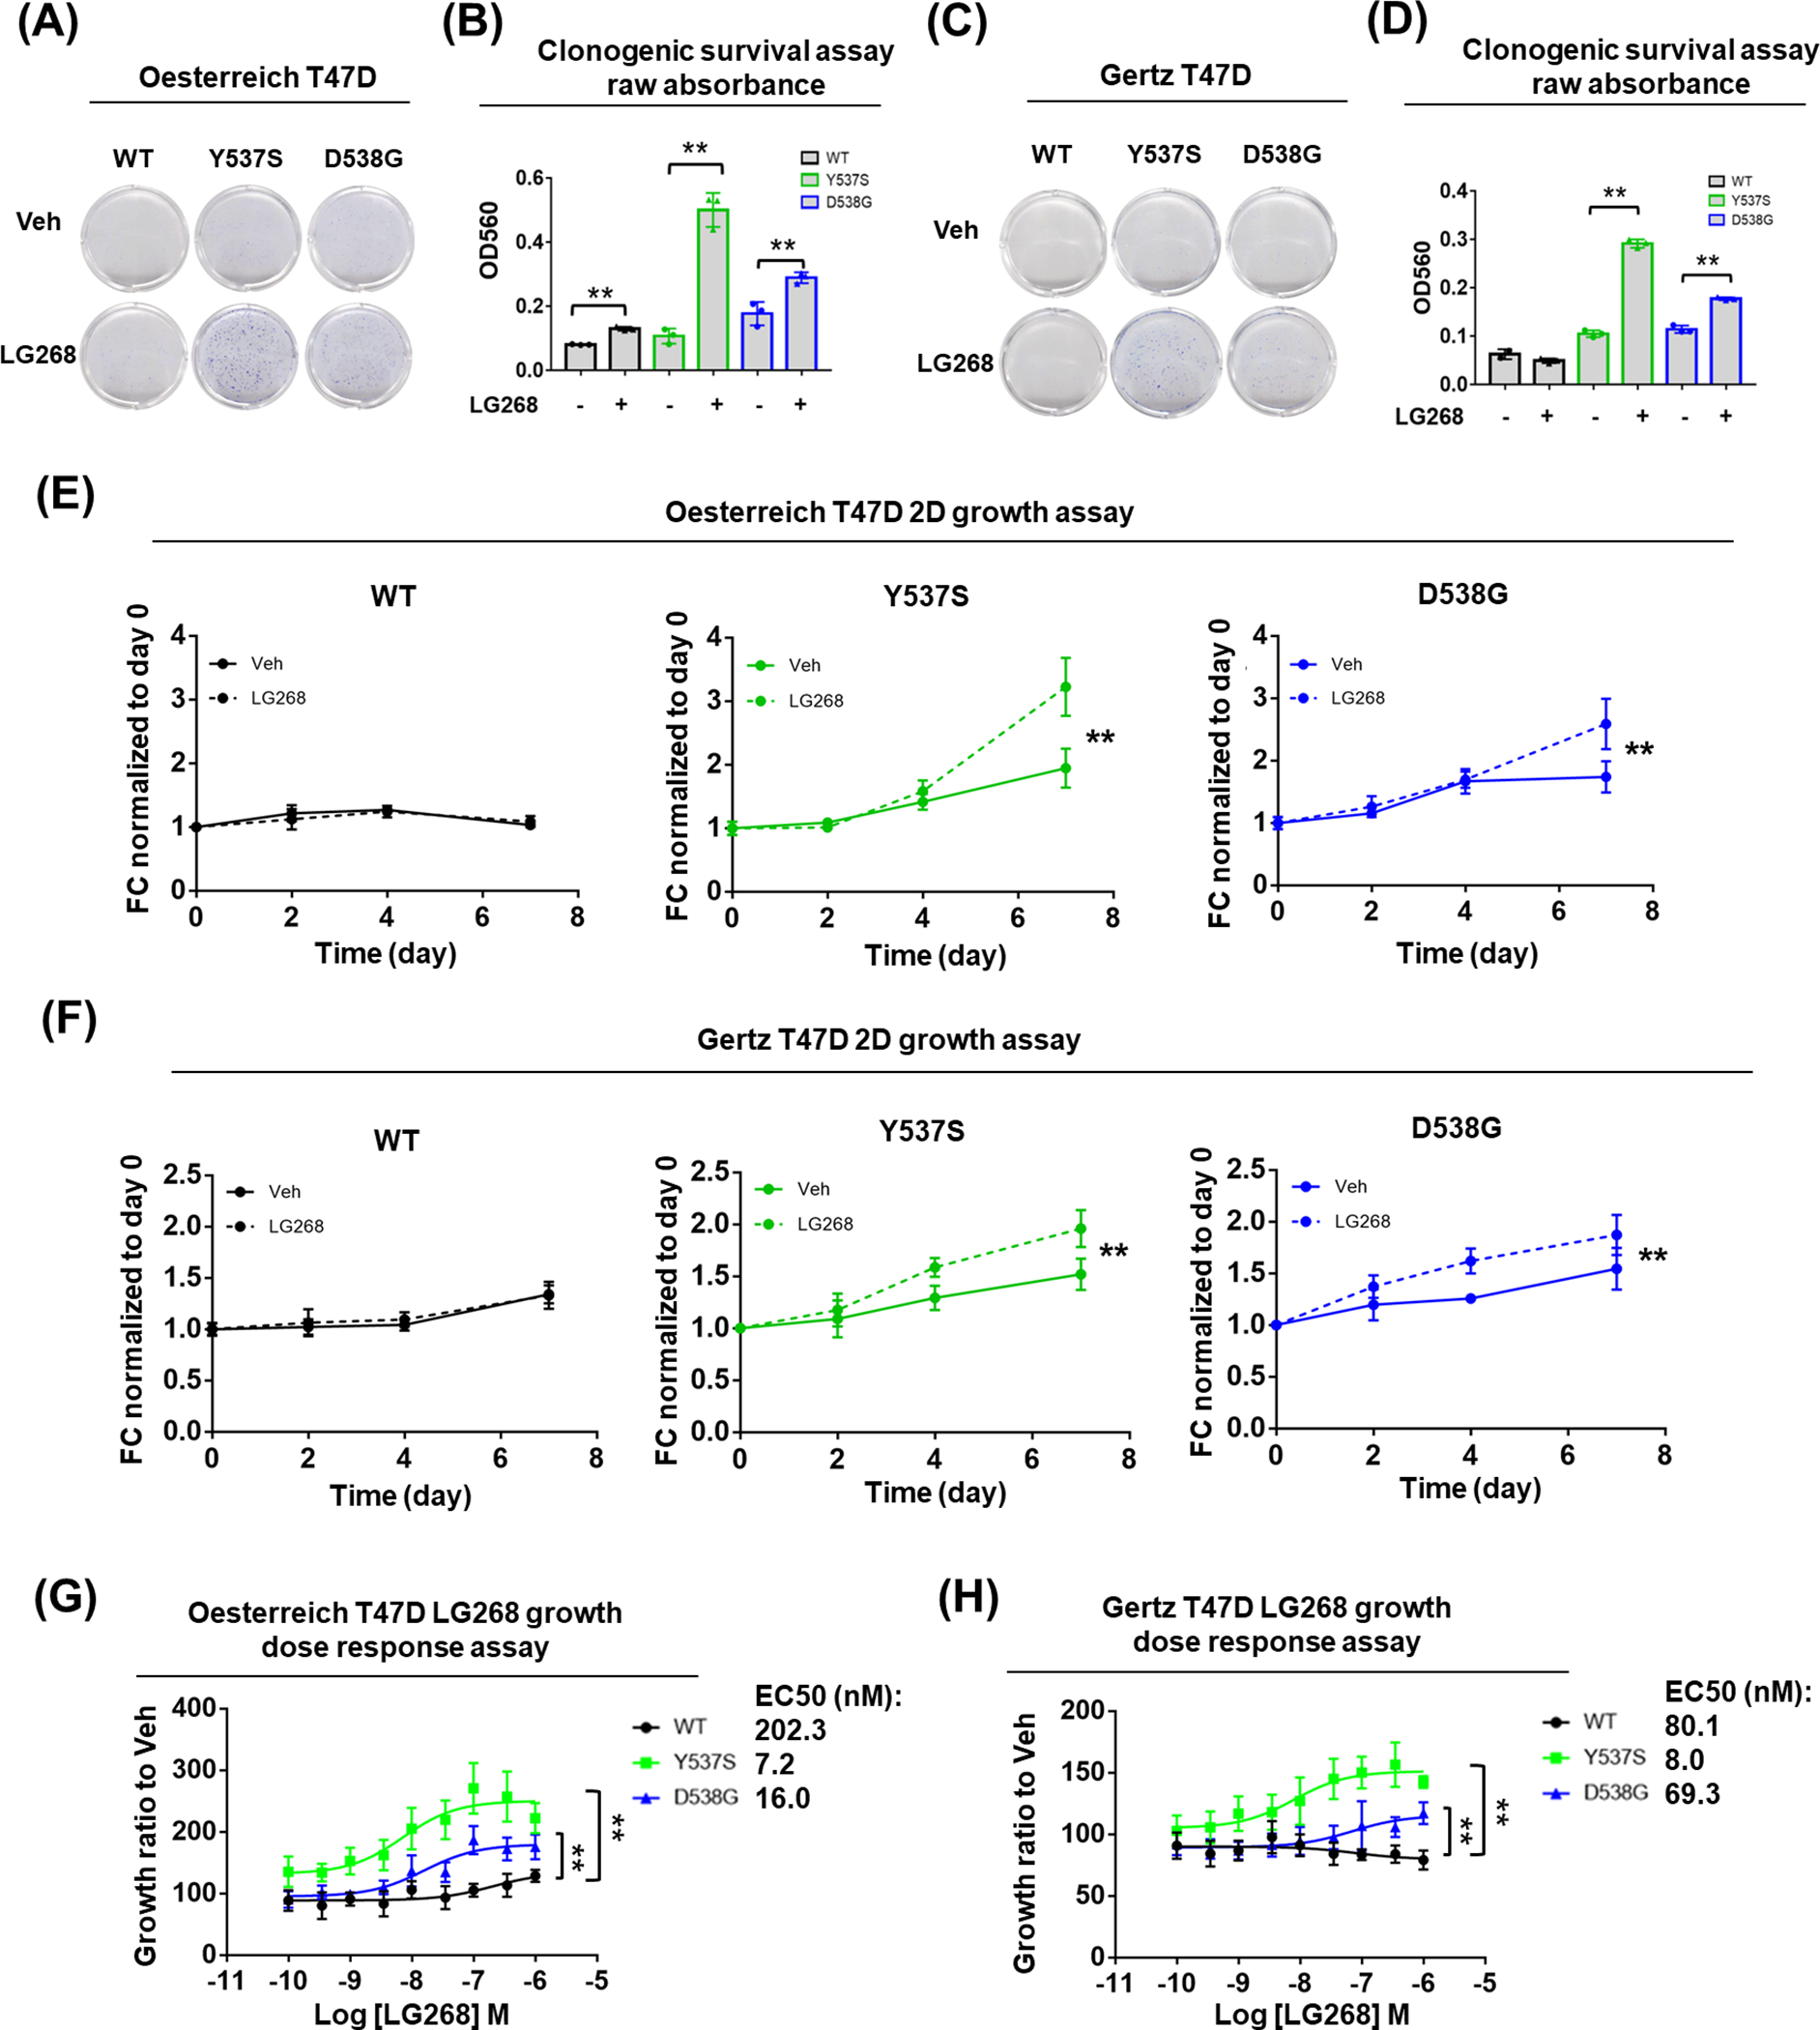
(A, C) Representative images of colonies formed after Veh or 100nM LG268 treatment in hormone deprived condition with Oesterreich (A) and Gertz (C) models for 14 days.
(B, D) Bar plot showing the quantification of A and C with raw absorbance OD560 of each group after crystal violet staining. Each bar represents mean ± SD with three biological replicates. Student’s t test was used to examine the effects of treatment between each group’s OD560. (** p<0.01)
(E, F) Growth curve of Oesterreich (E) and Gertz (F) T47D cells under Veh or 100nM LG268 treatment in hormone deprived condition. Cell amount quantified by FluoReporter kit at day 7 was normalized to day 0 and presented as fold change (FC). Each bar represents mean ± SD with five biological replicates. Two-way ANOVA was performed to compare the 100nM LG268 group and Veh group. (** p<0.01)
(G, H) LG268 dose response curve of Oesterreich (G) and Gertz (H) T47D cells. Cell amount quantified by FluoReporter kit at day 7 of all dose groups was normalized to Veh and presented as fold change (FC). Each bar represents mean ± SD with five biological replicates. EC50s were shown on the right side. Two-way ANOVA test was performed to compare the dose response between mutant and WT cells. (** p<0.01)